
February 2024
Shipping Lanes and Supply Chains
How will the Suez and Panama Canal crises affect the global economy and inflation?
Download PDFWe recently sat down with Dominic Nolan, CEO of Aristotle Pacific Capital, to get his insights into recent market action, the Fed’s next move, the state of the economy, and opportunities in fixed income. We finished up with a speed round of questions and a personal reflection.
Market Performance

Past performance does not guarantee future results. *The S&P 500 Equal Weight Index is the equal-weight version of the widely used S&P 500 Index, which is a stock market index tracking the performance of 500 large companies listed on stock exchanges in the United States. The Russell 2000 Value Index measures the performance of the large-cap value segment of the U.S. equity universe. The Russell 1000 Growth Index measures the performance of the large-cap growth segment of the U.S. equity universe. The S&P 500 Index is a stock market index tracking the performance of 500 large companies listed on stock exchanges in the United States. Bank loans represented by Credit Suisse Leveraged Loan Index, which is designed to mirror the investable universe of the U.S. dollar-denominated leveraged loan market. HY Corporates represented by Bloomberg US Corporate High Yield Index, which measures the USD-denominated, high-yield, fixed-rate corporate bond market. IG Corporates represented by Bloomberg US Corporate Index, which covers performance for United States corporate bonds.
Let’s start with markets. What happened in January?
The markets are coming off a really strong November and December. I’d call it a fourth quarter “melt up.” JI would call January’s performance as “sound.” The S&P 500 Index was up a little more than 1.5%. The Russell 1000 Growth Index was up about 2.5%. I think the real story is rates—in particular, the 10- year Treasury. It started the year at 3.9%—about the same level as the start of 2023—and it’s now 11 basis points higher than that. The consensus for over a year now has been rates should drop, but the 10- year continues to defy most investor expectations.
Why?
First and foremost, the economy has been more resilient than investors think. What we’re facing is the market toggling between expectations of strong economic growth—meaning the Fed is less likely to cut—and vice versa. That’s why you’re seeing a whippy market. We’re talking about moves of 1 or 2% on capital assets. To me, the real question is if the economy is sound but not hot, is that enough for the Fed to cut? If we have 2 to 3% GDP and inflation sitting at 2%, does the Fed cut? We’ll see what happens.
What do you take away from the Fed’s comments at its January meeting?
At a very high level, the Fed still seems data dependent, closely monitoring if inflation spikes a little bit or if the job market gets too hot. I think the Fed is in a good spot actually. A soft landing has now become the probable outcome. Last year, it turned out, the Fed was right to hold tight. The economy is still strong. To me, the Fed now has a bigger window to get it right and bring the economy in for a soft landing. As of now, I think they’re going to continue waiting to see confirmation that inflation has cooled before lowering rates.
Implied Fed Funds Rate and Number of Hikes/Cuts
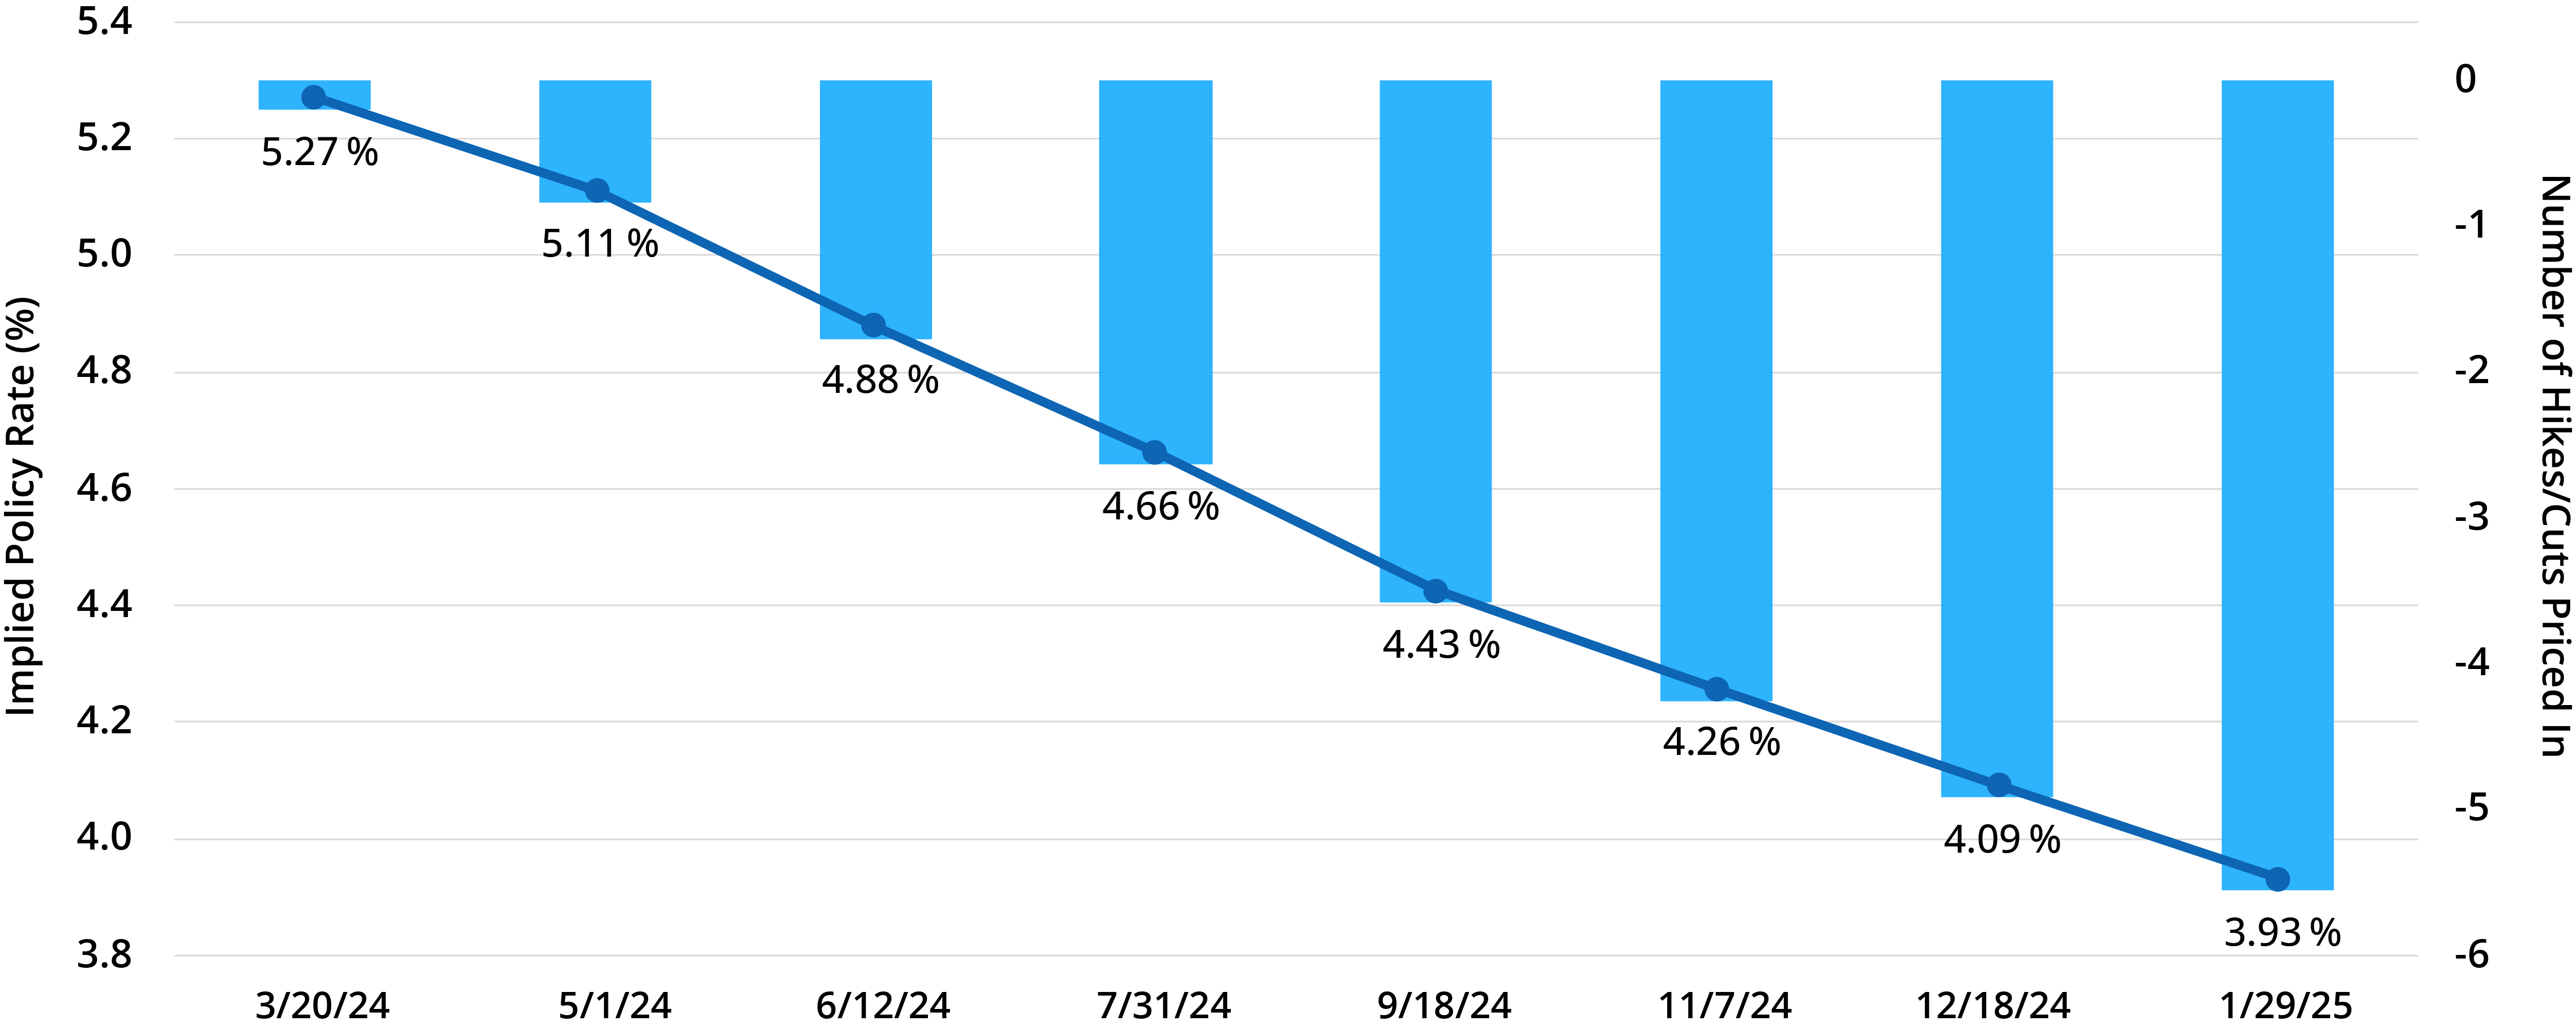
What’s the base case now for Fed cuts this year?
Market expectations are for 134 basis points in cuts over 12 months. So, back of the envelope, that translates to five or six cuts. Personally, I think that’s too dovish. My base case is for three to four cuts. I think a cut in March is off the table. So, if they don’t cut in March, then all of a sudden you get to May and the second half of the year. If you assume the Fed cuts every other meeting, you’re at three to four cuts—which, back to the original point, tells me the market seems to be a bit overzealous on the rate cuts.
What chance do you give the Fed reversing course and hiking rates again?
I give it a less than 10% chance and maybe even less than 5%. When you think about the situation that caused the Fed to raise rates, that was due to an exogenous shock. You had a pandemic that led to massive stimulus packages that fueled spending, which led to inflation. Again, outside of an exogenous shock, I don’t see the Fed raising rates. With the fed funds real yield over 2%, inflation would need to pick up dramatically.
Monthly Change in Nonfarm Payrolls

What’s happened to the economy so far in 2024?
The resilient economy continues to surprise. Over the past 12 months, we’ve said the economy is slowing but growing. There are a lot of recession mongers that come out when things start to slow, but they may forget to factor in that we are still growing. I think we are just coming off of high growth rates down to more normal growth rates. Look at the January jobs report: More than 353,000 jobs were added in the first month of this year. Unemployment is at 3.7%, and even below the surface of the jobs report, temp employment edged higher. That’s something that had been weakening, but over the past couple months it has edged higher.
How’s consumer spending holding up?
In 2024, credit-card spending has been flat or even negative year-over-year, according to Bank of America daily credit-card spending data. On the consumer side, they are hanging in—but spending is not hot. On the corporate side, a lot of infrastructure spend is coming into play, which means capital expenditures on the corporate side are helping the economy.
Quarterly Percent Change (SAAR)

Recent GDP estimates have been strong.
Yes. The Atlanta Fed GDPNow predicts GDP in January to be at a 4.2% That’s a big print. Now consensus is 3%, so my guess is the GDPNow number over the next two months will probably be ratcheted down, but 3% is still a very solid number. When you think about the past three quarters, those were the quarters that were originally thought to be going through recession a year ago. The economy has surprised massively to the upside. In general, the market beat expectations. A soft second quarter was expected, but the companies performed better than predicted.
Now, do you see any sectors that were permanently damaged from the pandemic?
I think the obvious one is office. The five-day office workweek seems to be permanently off the table for a lot of companies. Hybrid seems to be down the fairway. A debate now is: Should it be three days a week in the office? Two days? Four days? The end of the five-day office workweek will be catastrophic for a lot of tertiary office space. That’s not even factoring in small businesses that were built around supporting office workers.
Suez Canal South-to-North Crossings

Panama Canal South-to-North Crossings

We have a shipping crisis with container-ship traffic being squeezed at both the Suez and Panama canals. What’s causing the problems in both places?
It’s for two different reasons, but it all results in more supply-chain problems. Let’s start with the Suez Canal, which controls about 13% of global maritime trade. That number is down 50% due to Iranian-backed Houthis rebels attacking ships with drones. On the Panama Canal side, boat traffic is down 33%, but for a completely different reason: They have a drought, and the water shortage restricts the filling of certain locks. So, the Suez issue has been induced by humans, the Panama challenges have been induced by Mother Nature. Either way, it is bottlenecking supply chains because ships are either delayed, paying more for traversing the canals, or having to add thousands of miles to their routes by going around the tips of South Africa and South America.
Sea Freight Cost as a Share of Total Goods Consumption

Do you think this will significantly impact the global economy and the inflation fight?
Surprisingly, it may not. It’s estimated that the cost of goods sold—not the final purchase price—goes up about 2 to 3%. Let’s say the cost of a good is 30%, which means the final purchase price will go up just a fraction of that. In total, transportation costs are about 2% of total operating costs for S&P 500 companies. So that 2% is going up a little bit. For a company, I would say the canal issues end up costing less than 1%, which a business can absorb and take a margin hit or pass it through to the consumer. From a pure economic standpoint, the direct impact is a tax. Geopolitical elements result in a different set of risk factors.
Attractive Yields

Now let’s talk about bonds. Where are you seeing opportunities in fixed income today?
Floating-rate loans continue to be one of the most underappreciated asset classes in fixed income. Because spreads have come in a little bit, the Bloomberg US Aggregate Bond Index (Agg) yield is now 4.5%. For floating-rate loans, because the Fed is leaving short-term rates so high, the delta now is 500 to 600 basis points. Two years ago, the Agg was down double digits, and floating-rate loans were down just 1%. Last year, the Agg was up 5.5%, and floating-rate loans were up 13%. Going into the year, the yield for floating-rate loans was 600 basis points higher than the Agg. If you just do bond math, for the Agg to make up just the yield—let’s say 6 points—rates need to drop about 100 basis points, which means the 10-year Treasury needs to move close to 3%. That’s a big rate call, but folks seem to be comfortable making it. The reason I bring this up is that I believe, again, floating-rate loans have been underappreciated given that the asset class has seen outflows in 80 to 90% of the weeks over the past 18 months. If you “know” rates are going to drop, maybe extend duration, but that’s like knowing when equities are going to drop. It’s a big call, in my opinion. Long-term rates are so difficult to time.
Let’s shift gears and move to the lightning round. First word or phrase: Layoffs.
My view is, if you see a company come with layoffs of less than 10%, that’s belt tightening. If you see a company lay off 20%, that is a structural change in the business model. What I see right now is a lot of belt tightening.
Regional banks.
I think there are going to be more problems, but they’re manageable as it relates to our overall financial system.
Boeing 737 Max.
It just keeps getting worse. Boeing is the only American company that manufactures large-scale commercial airlines. It’s a travesty.
Taylor Swift.
NFL television ratings with the Chiefs were substantially higher, in part because of Taylor Swift. Good for her, good for the NFL. Haters are going to hate, but the Swifties have given the NFL a new fan base in the near term.
Bill Belichick.
It doesn’t surprise me he’s not been hired as a head coach in the NFL. He would come in and dramatically change the operations of any football team, and I don’t know if he’d be around long enough for the team to see the benefit.
Let’s close with a personal reflection.
We recently interviewed someone for an intern position, and she did a great job. In particular, she never used any ums or ahs in her answers, and that impressed me. I’ve heard experienced professionals use ums and ahs—basically filler words—often in their communication. Many times, it takes away from the impact of all your other words. The intern candidate reminded me once again there is strength in silence. To harness that power, you also have to be comfortable with silence. It’s impressive to see someone with the discipline and maturity to harness the silence. And in case you’re wondering, she’ll be working with us this summer.
Definitions:
10-year Treasuries are bonds issued by the U.S. government and have a maturity of 10 years.
The Atlanta Fed GDPNow is a running estimate of real GDP growth based on available economic data for the current measured quarter.
Bank loans (or floating-rate loans) are financial instruments that pay a variable or floating interest rate. A floating rate fund invests in bonds and debt instruments whose interest payments fluctuate with an underlying interest-rate level.
One basis point equals 0.01%.
The Bloomberg US Aggregate Bond Index (Agg) is composed of investment-grade U.S. government bonds, investment-grade corporate bonds, mortgage pass-through securities, and asset-backed securities, and is commonly used to track the performance of U.S. investment-grade bonds.
Bonds are debt instruments and represent loans made to the issuer. Governments and corporations commonly use bonds in order to borrow money.
Delta is a ratio that compares the volatility of the option price to the volatility of the underlying stock price. An option’s price is primarily made up of two distinct parts: its intrinsic value and time value. Intrinsic value is a measure of an option’s profitability based on the strike price versus the stock’s price in the market. Time value is based on the underlying asset’s expected volatility and time until the option’s expiration.
Dovish (or accommodative) policy favors expansionary monetary policy to achieve maximum levels of employment. The Fed does this by lowering the fed funds rate.
The federal funds rate is the interest rate that banks charge each other to borrow or lend excess reserves overnight.
The Gross Domestic Product (GDP) growth rate compares the year-over-year (or quarterly) change in a country’s economic output to measure how fast an economy is growing.
High-yield bonds (or junk bonds) are bonds that pay higher interest rates because they have lower credit ratings than investment-grade bonds.
Investment grade refers to the quality of a company’s credit. To be considered an investment grade issue, the company must be rated at ‘BBB’ or higher by Standard and Poor’s or Moody’s.
A risk asset is any asset that carries a degree of risk.
The Russell 1000 Growth Index measures the performance of the large-cap growth segment of the U.S. equity universe. It includes those Russell 1000 companies with higher price-to-value ratios and higher forecasted growth values.
The S&P 500 Index is a stock market index tracking the performance of 500 large companies listed on stock exchanges in the United States.
A soft landing refers to a moderate economic slowdown following a period of growth.
U.S. Treasury rates or yield is the effective annual interest rate that the U.S. government pays on one of its debt obligations, expressed as a percentage.
Yield is the income returned on an investment, such as the interest received from holding a security.
Any performance data quoted represent past performance, which does not guarantee future results. Index performance is not indicative of any fund’s performance. Indexes are unmanaged and it is not possible to invest directly in an index. For current standardized performance of the funds, please visit www.AristotleFunds.com.
The views expressed are as of the publication date and are presented for informational purposes only. These views should not be considered as investment advice, an endorsement of any security, mutual fund, sector or index, or to predict performance of any investment or market. Any forward-looking statements are not guaranteed. All material is compiled from sources believed to be reliable, but accuracy cannot be guaranteed. The opinions expressed herein are subject to change without notice as market and other conditions warrant.
Investors should consider a fund’s investment goal, risk, charges and expenses carefully before investing. The prospectus contains this and other information about the fund and can be obtained at www.AristotleFunds.com. It should be read carefully before investing.
Investing involves risk. Principal loss is possible.
Aristotle Funds and Foreside Financial Services, LLC are not affiliated with Pacific Life Fund Advisors LLC.
Foreside Financial Services, LLC, distributor.


