
Chart Library
Is the Productivity Cycle Turning?
Productivity has historically advanced in long cycles, with major gains emerging during periods of technological innovation. The Internet and IT boom of the late 1990s and early 2000s drove a sustained surge in both labor productivity and underlying efficiency, while the post-GFC period marked a prolonged slowdown. Since 2020, labor productivity has reaccelerated above its long-term average, and recent advances in artificial intelligence (AI) have renewed optimism that a new productivity cycle may be emerging. However, total factor productivity (TFP)— often viewed as a cleaner measure of efficiency gains—remains below prior peaks, suggesting broader adoption and implementation will be necessary to confirm a durable AI-driven shift.

Past performance does not guarantee future results. Investing involves risk, including loss of principal. Total Factor Productivity (TFP) measures how efficiently an economy or business converts raw inputs into final output. CAGR measures the annualized rate of return between a beginning and ending value.
Note: Lines show 7-year trailing CAGR. Shaded figures show period CAGR of the underlying level series.

Credit: More Profits, More Yield
With U.S. corporate debt issuance rising this year amid elevated geopolitical risk and a K-shaped U.S. economy, some investors may be questioning the asset class. Yet the broader corporate backdrop remains strong: U.S. corporate profits have continued to climb to record highs. That profitability can provide an important source of resilience for companies—and support for their debt—through periods of uncertainty.
Meanwhile, yields remain attractive. At the end of April, investment-grade corporate bonds offered yields of more than 5%, while high-yield bonds yielded nearly 7% and bank loans yielded more than 8%.

Earnings Growth Bolsters Case for Corporate Bonds
S&P 500 Index earnings are on pace for their strongest year-over-year growth since late 2021. With more than 90% of first-quarter 2026 results reported, blended profit growth stands at 27.7%, according to FactSet. That would mark the sixth consecutive quarter of double-digit earnings growth and supports our constructive view of investment-grade corporate bonds. Double-digit growth is expected to continue in each remaining quarter of 2026.
Technology continues to lead, with first-quarter earnings of S&P 500 tech companies projected to rise 51%. But the strength is broadening: commercial services, materials, consumer discretionary, financials, industrials and utilities are also posting double-digit gains.
The broader backdrop remains supportive for corporate bonds, with low unemployment, resilient consumer spending, and the Federal Reserve on hold. Inflation bears watching, particularly amid geopolitical disruptions, but companies and governments are adjusting to the closure of the Strait of Hormuz. A lasting resolution to the Iran conflict would likely provide an additional tailwind for bonds.

Credit's Resilience in the Face of Oil Volatility
When oil prices fall sharply, credit markets can sell off alongside other risk assets –but history shows those dips tend to be short-lived. Looking back at 7 major disruptions since the Gulf War of 1990, most credit markets briefly turned negative in the early weeks following each shock but quickly rebounded: Investment-grade corporate bonds returned an average 6.7% in the year since such shocks began, while high yield returned 11.4%.

Bank Loans: A Record of Resilience
Many Investors view bank loans as having a reputation for vulnerability—but the data tells a different story over the past 5 years. When stacked against investment-grade bonds, loans have proven remarkably steady through turbulent markets. Since April 2021, the Bloomberg US Aggregate Bond Index (the "Agg") has posted negative monthly returns 27 times—loans, just 11. Even more striking: In those down months, when the Agg averaged a -1.41% loss, the Morningstar LSTA US Leveraged Loan Index delivered an average gain of +0.59%.

Bank Loans: Delivered Across Market Cycles
Late in a market cycle, concerns about credit quality can lead investors to consider shifting from bank loans to traditional bonds. However, the data suggests that bank loans have historically offered a compelling alternative.
Across multiple time horizons—from three to 15 years—bank loans have delivered meaningfully higher returns than investment-grade bonds, as represented by the Bloomberg U.S. Aggregate Bond Index. At the same time, they have demonstrated favorable risk characteristics, with significantly lower volatility over shorter periods and only modestly higher volatility over longer horizons.
For example, over the past three years, bank loans generated a return of 7.8%, outperforming the broad fixed-income index by 268 basis points, while exhibiting 355 basis points less volatility. This combination of higher returns and attractive consistency underscores the strong risk-adjusted profile of bank loans.

Investment-Grade Bonds Offer Compelling Income and Return Opportunities
Many areas of fixed income continue to offer investors compelling income and total return potential. Although investment-grade corporate bonds began 2026 with a yield of 4.75%, 54 basis points below where they started 2025, investors may still benefit from their total return profile. Historically, when investment-grade corporate bonds have carried a yield above 4%, they have generated an average return of 8.91%.

Active Investing in Fixed Income has Led to Higher Returns
Active and passive mutual funds and ETFs generally contain interest rate risk and credit risk. However, active managers are able to adjust portfolio positioning to respond to these risks, seeking to maximize potential risk-adjusted returns at both the security and portfolio levels.
In contrast, passive fund managers must adhere to the composition of an index and cannot adjust a fund’s interest rate sensitivity (duration) in response to signals from the Federal Reserve, economic growth, inflation, or other factors influencing the path of interest rates.
Because interest rate movements often drive bond market returns, the flexibility to actively manage duration and credit exposure can help provide an advantage in fixed income investing. As shown in the chart, this flexibility has translated into consistent outperformance of active strategies over passive alternatives across the 1-, 3-,5-, and 10-year periods.

Software Credit Spreads Diverge from Broader Leveraged Loan Markets
Floating-rate leveraged loans include broadly syndicated loans (BSLs), which trade daily, and private credit loans, which tend to be less liquid. Software companies represent a relatively small portion of the broadly syndicated loan market, estimated at less than 10%, but account for a larger share of private credit exposure, closer to 20%. Year-to-date, spreads in the broader leveraged loan market have widened modestly, while spreads on software loans have widened significantly more. This widening gap highlights increasing pressure in software-related credit, reflects structural differences between liquid syndicated loans and less liquid private credit markets, and reinforces the importance of careful credit selection in today’s environment.

Historically, Higher Yields Signaled Increased HY Bond Returns
We analyzed nearly 40 years of the Bloomberg U.S. Corporate High Yield Index and plotted starting yield-to-worst against subsequent 12-,18-, and 24-month total returns. Historically, higher starting yields coincided with higher subsequent returns. Given the current yield environment, investors may want to consider an allocation to High-Yield bonds.

Intermediate IG Bond Performance vs. the Agg
While some investors would think that intermediate investment-grade (IG) corporate bonds only do well when risk assets have rallied, historically the asset class has outperformed the Bloomberg US Aggregate Bond Index (Agg) in both good times and bad. Looking at rolling three-year return periods, when the Agg has returned 0% or less, intermediate investment-grade corporate bonds have outperformed the index by an average of 2.13%. And when returns for the Agg has returned 5% or more, intermediate investment-grade corporate bonds have outperformed the Agg by 0.29%.

Keeping up with the Changing Fixed-Income Market
Back in 1993, the Bloomberg US Aggregate Bond Index was made up of 6,074 issues, had a market value of $3.9 trillion and, dating back to 1976, had never experienced negative returns in two consecutive calendar years. Today, the investment-grade bond market is made up of 13,974 issues, has a market value of $30.87 trillion and experienced its first negative returns in consecutive years (2021 & 2022). With how much the fixed-income market has changed over three decades, is it time for a different investment approach and to consider corporate bonds?

Navigating Narrow Yield Spreads: The Importance of Active Credit Selection
Risk assets have continued to move higher and yields lower as the U.S. economy continues to push forward. With this yield compression, the convergence between BB high-yield bond yields and BBB corporate bond yields has remained near multi-year lows, making credit quality selection more difficult for investors. At current levels, the difference between BB and BBB corporate bond yields is less than half of it’s historical average at just 73 basis points vs. 148 basis points. In addition, high yield bond investors are only being paid 212 basis points more yield than investment grade corporate bonds – the long-term average is 381 basis points. This yield compression contributes to the challenges of fixed income investing today, highlighting the value of actively managed funds that can rotate with discretion between non-investment grade and investment grade fixed income.

Short-Term Corporates Have Outperformed Through Rate Cutting Cycles
Over the past two decades, short-term corporate bonds have historically delivered higher yields than comparable Treasuries and money market instruments – outperformed in nearly every market and interest rate environment since 2000. Even through multiple Fed tightening and easing cycles, short-term credit has maintained a steady yield advantage, rewarding investors who extend modestly beyond cash while keeping duration risk low.

Consistent Outperformance of Short-Term Credit Over Treasuries
Over the past two decades, short-term corporate bonds have consistent outperformance over short-maturity Treasuries, outperforming in 96% of rolling five-year periods. On average, it has delivered an annualized excess return of 1.04%. Even in the worst five-year stretch, underperformance was limited to -1.38%, while the best period saw a 3.61% annualized outperformance. This consistency highlights short-duration credit as a dependable source of added value with limited downside.

Short-Duration Bonds Can Hold Yield Advantage as Fed Cuts
Short-term and ultra-short bonds are currently yielding more than money markets and T-Bills, despite being only slightly further out the curve. Importantly, as the Fed begins the new rate cutting cycle, money market and T-Bill yields will reset lower almost immediately, while short-duration bonds can hold on to higher yields longer, offering investors more stability through the transition.

Short-Term Bonds Performance After 1st Rate Cut
In six of the seven latest rate-cutting cycles, short-duration corporate bonds have outperformed the Bloomberg Short Treasury 1-3 Mon Index and the Bloomberg US Treasury 1-3 Yr Index the 12 months following the first rate cut by an average of 3.99% and 1.82%, respectively. For advisors ready to move beyond T-Bills, short-term credit may present a compelling opportunity. This performance edge has historically been achieved with lower volatility, making short-term credit a compelling alternative as interest rates move lower.

Investors Bail on Long-Term Bonds
Long-term bond funds with an average duration of 11.9 years have seen heavy outflows, with six straight months of withdrawals and some of the steepest drops in the five past years. In contrast, investors have piled into ultra-short and short-duration funds, attracted by yields that remain competitive with longer-term bonds but with far less volatility. Even if the Fed cuts rates by 50 bps this year, short-end investors will continue to earn attractive income while avoiding the sharp price swings that affect longer-maturity bonds. This combination of steady income and limited rate sensitivity explains the unprecedented outflows from long-term bond funds and the demand for short and ultra-short bonds.

Short Duration Bonds Have Offered the Most Spread Cushion
Short-end corporate bonds still have meaningful room for spreads to compress versus their historical tights, particularly in the BBB and A maturity buckets under 7 years. At the very front-end, both single-A and BBB securities have 15-20 basis points of room before reaching their historical tights. At 5 years, there’s about 10 basis points left while 10 years have 10-15 basis points. In the 25 year and above segment, spreads across ratings have only marginally moved from recently reached all-time tights. This suggests that the marginal push tighter will likely be driven by shorter duration and that shorter-duration credit is the part of the market best positioned to potentially benefit if spreads continue to compress.

Investment Grade Bonds Historically Outperform After First Rate Cut
In six of the seven latest rate-cutting cycles, investment-grade (IG) corporate bonds have outperformed the Bloomberg US Aggregate Bond Index (Agg) and the Bloomberg US Treasury Index the 12 months following the first rate cut by an average of 2.90% and 3.92%, respectively. And with only 11 investment-grade corporate bond defaults in 25 years, these higher returns have historically come with low levels of risk that rival government securities.

Unemployment and Corporate Debt
Even with a pandemic collapse, global conflicts, and trade war, investors have yet to see in recent years a prolonged spike in the U.S. unemployment rate. But historically, when the unemployment rate hit certain ranges, corporate debt has provided a great complement to fixed-income portfolios. Since the year 2000—except for when unemployment ranged between 4.50% and 4.99% (which has happened only 10% of the time)—investors would have been better served by allocating fixed-income assets to corporate debt or having corporate debt as a complement to an index fund that tracks the Bloomberg US Aggregate Bond Index.

Bank Loans: Traditional vs. Newer Option
While investors may consider new “more sophisticated” investment vehicles touting potential better returns and higher yields, these do not come without risk. When looking at the Morningstar Bank Loan category—comprised of mutual funds that typically invest in bank loans—the funds have generated attractive returns over the past three years (ending 7/31/25) with limited volatility and low drawdown when the asset class has struggled. In comparison, the Morningstar Closed-End Interval Bank Loan category—comprised of funds that invest in Collateralized Loan Obligations (CLOs), bank loans, and more illiquid asset classes—has generated lower returns, more volatility, and had more downside over the past three years than bank-loan mutual funds.

Q2: Strong Earnings for High Yield
This has been the strongest earnings season for high-yield companies in two years. The market is broadly in agreement; since the unofficial start of earnings season on July 15, high-yield spreads are essentially unchanged, yields are 28 basis points tighter, and the S&P 500 is up 2.3%. Guidance has been strong in aggregate with industrials and services remaining the positive outliers. 2.7x as many high-yield companies (37%) have beaten EBITDA (earnings before interest, taxes, depreciation and amortization) expectations as missed (14%). 1.6x as many high-yield companies have provided guidance that analysts interpreted as positive (30%) vs. negative (19%). 29% of companies have warned that they are experiencing inflationary pressures (down from 41% in 1Q25), and 23% of companies are warning about tariffs (75 out of 323).

On Yields and Risk
Over the past decade, yield levels across fixed-income sectors have fluctuated widely, but current yields are generally sitting in the upper half of their historical ranges. Yields of high-yield bonds and bank loans are near decade highs, even as spreads remain tight. We believe ongoing fiscal expansion will likely drive heavier Treasury issuance and raise the risk of higher government yields that further pressure spreads. Against the backdrop of elevated rate risk and supply-driven volatility, credit strategies may provide a more resilient path forward for income-seeking investors.

Is it Worth the Risk?
Credit spreads exist to compensate investors for the extra risk in purchasing a credit-risky bond over a risk-free bond. While investors might expect default rates for corporate debt to be closer to the average credit spread offered by corporates, this has not been the case over the past 23 years. During this period, corporate-bond investors have seen the delta between corporate bond spreads and default rates at or near multi-year highs, as defaults have continued to sit at or near multi-year lows. This makes the case that investors may be getting compensated above what they should be for the default risk.
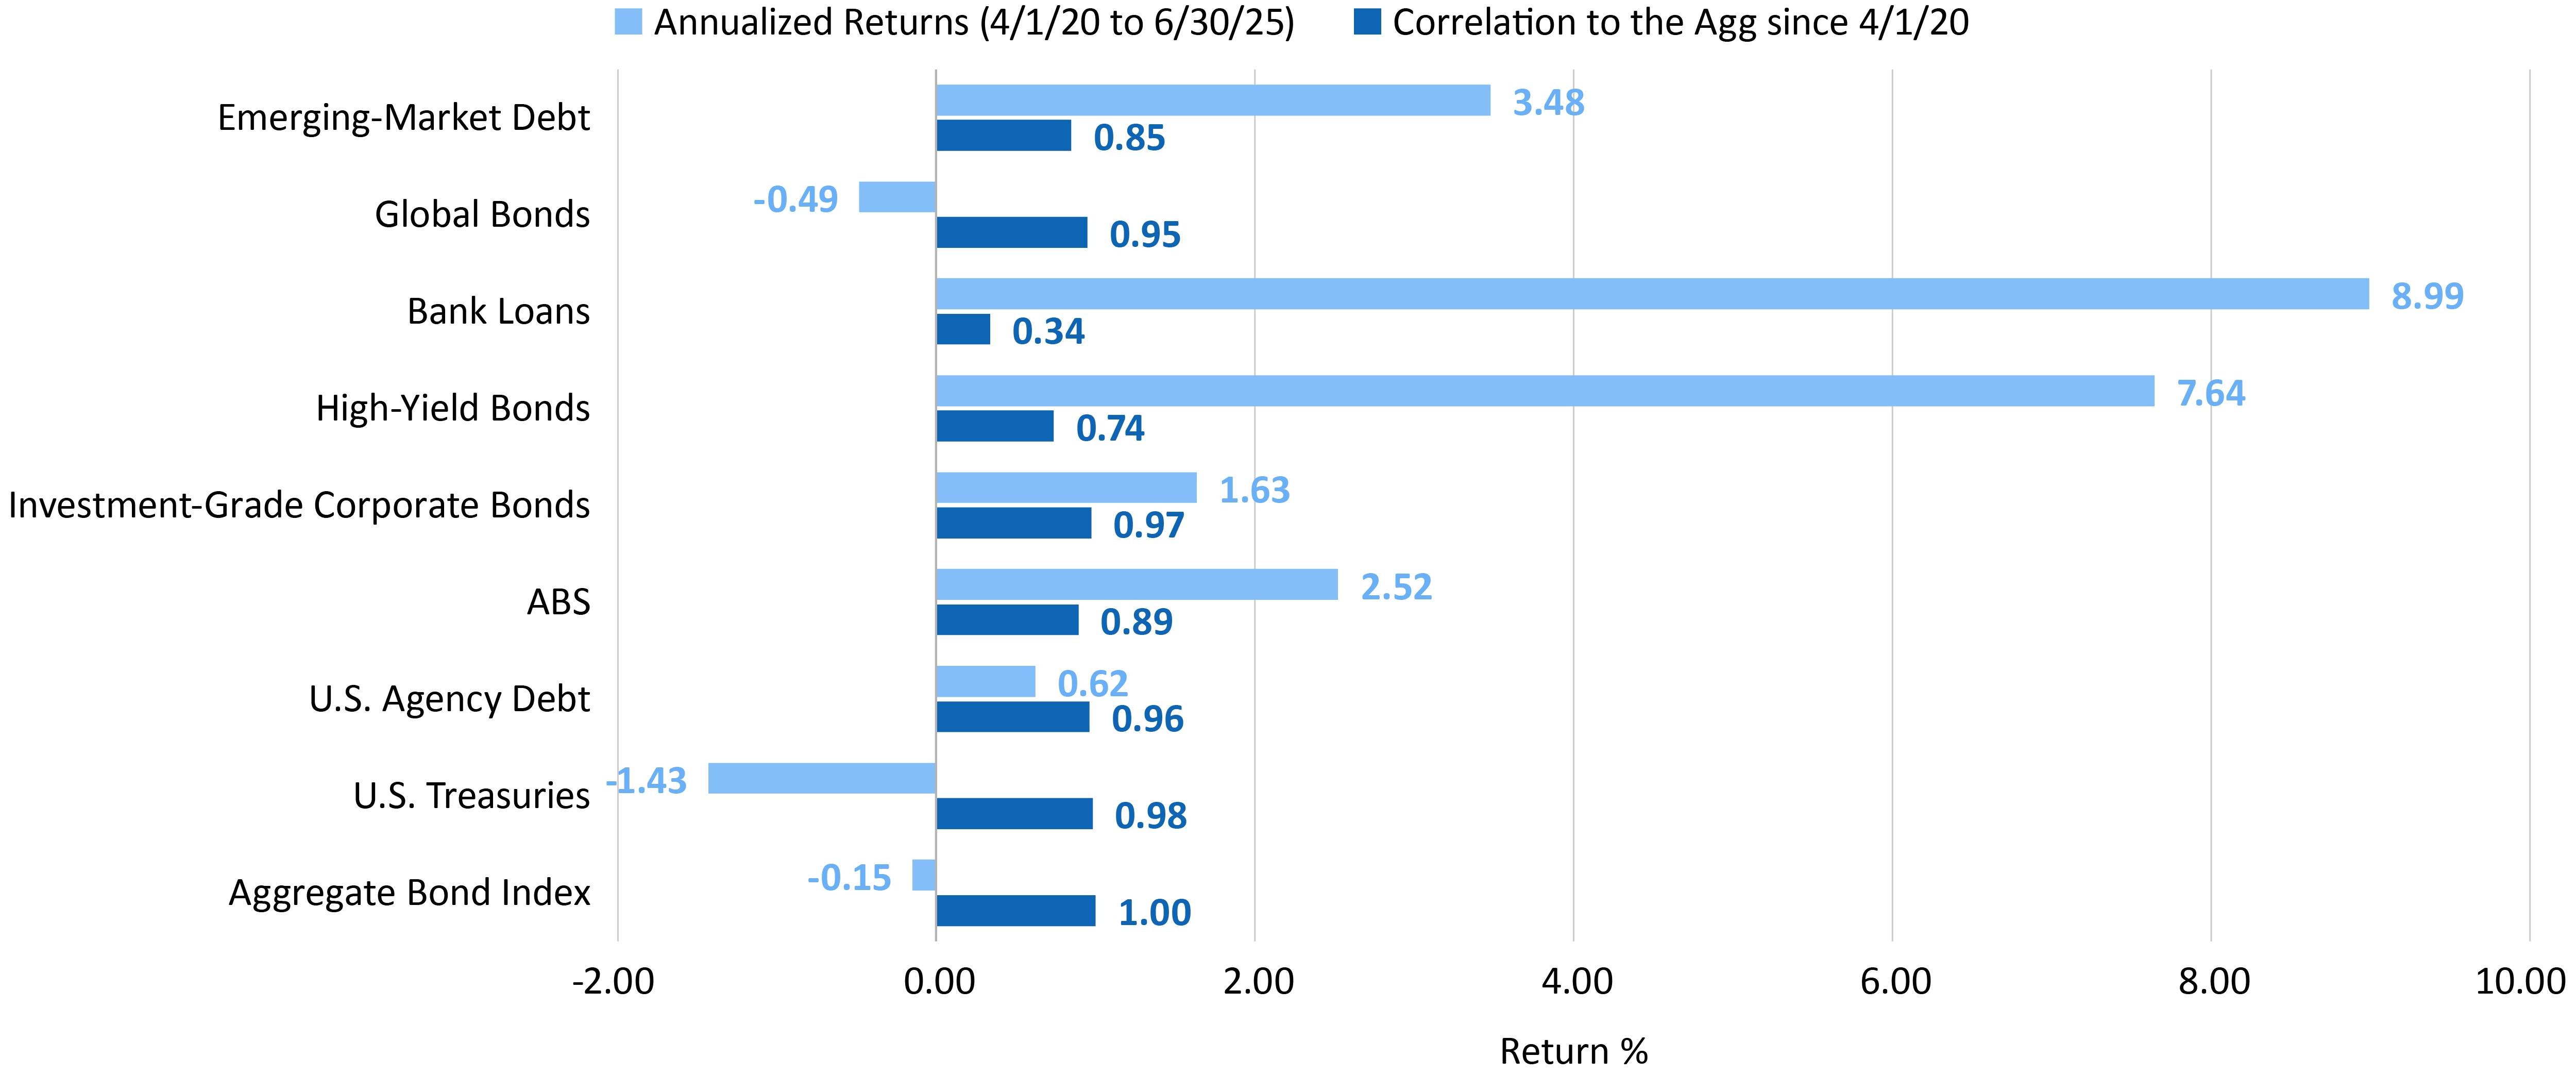
The Case for Fixed-Income Diversification
In the world of fixed income, non-core sectors have generally outperformed core sectors since 2020 by having a lower correlation to broad investment-grade bonds, which has resulted in reduced volatility and additional return. The two best-performing fixed-income asset classes in the past five-plus years have been non-core corporate bond sectors: high-yield bonds and bank loans. Not only have they been two of the best diversifying fixed-income asset classes since 2020, but they have also generated “equity-like” returns annually.

High Yield's Shift to Shorter Duration
The high-yield bond market now has limited long-duration exposure, as nearly 70% of high-yield debt can be found in the two- to six-year maturity bucket and only 1% has more than 11 years to maturity. On the other hand, approximately 30.5% of the investment-grade corporate-bond market has a maturity greater than 20 years. From a risk-return perspective, the current yield premium of high-yield bonds of 7.91% over investment-grade corporate bonds’ 5.85% stands at 206 basis points, which is a relatively narrow spread given high yield’s historically higher default rates and the historic yield spread for high yield of 384 basis points.

Yields and Investment-Grade Bonds
Are today’s headlines about volatility in the market distracting investors from considering new-issue yields in investment-grade corporate bonds? Year-to-date, new-issue investment-grade corporate bonds still offer on average the same yield they offered throughout 2024 and just 29 basis points off their 2023 high of 5.62%. In addition, so far in 2025, investment-grade bonds have tilted toward higher-quality credits, as 57% of them currently have a credit rating of single A or higher vs. 53% in 2024 and 2023.

IG Bonds' Strong Starts and Finishes
Since 1997, investment-grade (IG) corporate bonds have, on average, not only done well relative to other fixed-income asset classes in the first half of the year, but they have also held strong in the second half of the year. While historically most investment-grade fixed-income returns tend to be more front loaded in a calendar year (the Bloomberg US Aggregate Bond Index, mortgage-backed securities, and U.S. Treasuries have seen approximately 62% of the average calendar-year returns happen in the first half of the year), investment-grade corporate bonds have seen a more balanced breakdown of calendar-year returns.

Passive Fixed Income's Underperformance
Are passively managed fixed-income investments worth the cost savings? When looking at four major areas of fixed income that have historically rewarded investors with price appreciation and attractive yields, passive investing has not stood the test of time. Over the past five years (5/31/20 to 5/31/25), passive management for intermediate core bond, corporate bond, high-yield bond and bank-loan asset classes combined have underperformed their respective benchmarks on average by -1.07%.

Corporate Debt's Outpeformance
The Bloomberg US Aggregate Bond Index (Agg) has given back 99% of the returns it earned from 2019 to 2022, largely due to a -13.01% performance in 2022. And if you were an investor who thought buying the dip after 2021 was a good idea, the current cumulative return for the Agg from 2022 through April 2025 was -0.44%. During that same period, corporate debt saw returns of 22.64% (bank loans), 10.08% (high-yield bonds), and 4.12% (intermediate-term investment-grade corporate bonds).

MBS or IG Corporate Bonds?
Since 1980, the additional risk of investing in investment-grade bonds instead of mortgage-backed securities (MBS) has paid off for investors. Over that period, investment-grade corporate bonds have generated a cumulative return of 2,370% vs. 1,671% for MBS, equating to $69,925 more in account value based on a $10,000 investment.

The Cushion Yields Provide Bank Loans
Given the current interest-rate environment and today’s bank-loan yields, if investors saw bank-loan prices drop by 5.8%, they would still be in a potential gain position for the year with the asset class offering yields of 9.17% (3-month SOFR rate) and 9.16% (1-month SOFR rate). And even if bank-loan yields dropped by 3%, investors would still be in a gain position if prices declined by 5.8%.

How Bank Loans Have Performed in Down Years
Amid market pullbacks, investors may want to consider the performance of bank loans since the Global Financial Crisis of 2007-2009, as risk assets do not proportionately impact this asset class unlike many others.

Longer Duration Has Paid Off So Far in 2025
While some investors—uncertain about the Federal Reserve’s next moves—have recently migrated to the low risk of money-market funds or short-term bond funds, they may miss out if interest rates start to decline. With their added duration, intermediate-term fixed-income funds have historically provided more upside potential than money-market funds or short-term bond funds when rates start to drop.

The Added Flexibility of Multisector Bonds
While more traditional intermediate core bond funds tend to be closely aligned with the Bloomberg US Aggregate Bond Index from a quality, duration, and asset-class standpoint, multisector bond funds’ greater flexibility to invest in both non-investment-grade and investment-grade bonds provides the ability to dial up or down duration and quality, depending on market conditions. All of this has led some investors to consider a multisector bond fund as a core bond investment and diversifier given its flexibility and diversification.

Is the Time Right for Corporate Debt?
Historically, when investment-grade corporate bonds, high-yield bonds and bank loans have reached the same price and yield levels as today's, they've generated a 12-month return well above each asset class’s 20-year annualized return (6.49% for high-yield bonds; 3.96% for investment-grade corporate bonds; and 4.74% for bank loans).

IG Bonds and Discount Prices
Though many risk-related asset classes have begun to lose traction this year, intermediate investment-grade bonds have continued to see prices hold at a discount relative to both their long-term and post-Global Financial Crisis averages. Since 1991, intermediate investment-grade corporate bonds have only seen the average price for the asset class at current discounted levels 12.7% of the time. In contrast, 74.5% of the time the average price was above par ($100) at month’s end.

The Rise of the Bank-Loan Market
It has started to look like investors have shifted their perception of the bank-loan market from being a tactical asset class for a rising interest-rate environment to a strategic allocation in their portfolios. The loan market today is now roughly equal to the high-yield bond market, and this steady growth has also led to loans now making up the majority of leverage credit market at 52% (48% for high-yield bonds).

Better Value, Yield Now Outside the U.S.
Strong U.S. growth has pushed stock valuations to record levels, as investors have benefited from the post-pandemic rally, a favorable interest-rate environment, and the surge in AI. However, international stocks have not benefited from the same tailwinds. But with uncertainty looming over the U.S. economy and elevated levels of volatility hitting investor’s portfolios, investors may find international equities—with their more attractive relative value and higher dividend yield—increasingly attractive.

Bank-Loan Yields and Falling Rates
Bank loans historically have seen yields decrease when interest rates lower, but this relationship is not necessarily proportional. Since the Federal Reserve’s first rate cut in 2024, bank loans have yields decreased by only about 75% relative to the size of a Fed interest-rate cut.

Is Now the Time for International Stocks?
From 2019 to 2024, the U.S. dollar returned 6.53%. But with interest rates expected to move lower and the economy slowing, the U.S. dollar has declined -4.34% this year, which may present an opportunity for investing in international stocks. During the past four times the U.S. dollar declined for four months or more, global equities have on average outperformed U.S. large-cap stocks by 10.90%.

Corporate Credit's Persistent Return Advantage
The additional yield offered by corporate debt has rewarded patient investors. Over the past 40 rolling 10-year periods, corporate bonds have outperformed two more conservative fixed-income counterparts: U.S. Treasuries and mortgage-backed securities (MBS). Investment-grade corporate bonds outpaced those two asset classes 97% of the time, while high yield did so 94% of the time. Not only that, over the past 10 rolling 10-year periods, IG corporate bonds and HY bonds have generated a positive risk-adjusted return of 0.40% and 3.57%, respectively, vs. -1.14% for Treasuries and -0.93% for mortgage-backed securities.

Bank Loans and Lower Volatility
In addition to generating potentially higher yields during times of rising interest rates, bank loans have also helped to reduce volatility in investors’ portfolios since 2021. Not only that, in times where investors have rotated out of loans (typically when interest rates have been cut), the rolling 12-month standard deviation for loans has decreased and now sits well below major investment-grade asset classes such as U.S. Treasuries, mortgage-backed securities (MBS), commercial mortgage-backed securities (CMBS), and broad investment-grade bonds in the Bloomberg US Aggregate Bond Index.

What Can Coupon-Like Returns Look Like?
While the market expects fixed-income returns for 2025 to be coupon-like given where yields currently stand, that could potentially put calendar-year returns well above their 20-year averages. For corporate debt
(investment-grade corporate bonds, high yield, and bank loans), a corporate-debt investor could see excess returns (relative to each asset classes’ long-term average of 2.26%) above many more conservative fixed-income asset classes.

Putting Default Worries in Perspective
Investor concern about defaults and distressed exchanges for high-yield bonds and leveraged loans may be overblown. Through the first nine months of 2024, there have been only 65 defaults/distressed exchanges for those asset classes for a default rate of 1.64% for high-yield bonds (historical average: 3.40%) and 3.70% for leveraged loans (historical average: 3.40%). Digging a bit deeper, much of the default and distressed-exchange activity this year (38%) and historically since 2008 (about 18%) came from repeat offenders, meaning many active managers would likely be leery of further investing in those names.

Over Long Run, Corporate Debt Has Outperformed Treasuries and MBS
Historically, the additional yield offered by corporate debt has paid off for patient investors. Corporate debt has outperformed two of its more conservative fixed-income counterparts—U.S. Treasuries and mortgage-backed securities (MBS)—over the past 40 rolling 10-year periods. Investment-grade corporate bonds outpaced those two asset classes 94% of the time, and high yield outperformed them 91% of the time. Not only that, over the past 10 rolling 10-year periods, investment-grade corporate bonds and high-yield bonds have generated a positive risk-adjusted return of 0.21% and 0.45%, respectively, vs. -0.04% for Treasuries and -0.03% for mortgage-backed securities.

Investment-Grade Bonds and Spreads
Are today’s option-adjusted spreads for investment-grade corporate bonds at 84 basis points1 too tight? Well, consider this. They are still well above their record low of 51 basis points, and the past four times that spreads were at current levels:
•They continued to tighten on average for another 25 months on average;
•It took an average of 36 months for spreads to return to their long-term average of 120 basis points;
•Investment-grade corporate bonds had an average price ($106.76), well above where they stand today($95.97)1; and
•They had an average yield (4.25%), well below today’s level (4.67%). 1

Performance of IG Bonds After 1st Rate Cut
In five of the six latest rate-cutting cycles, investment-grade (IG) corporate bonds have outperformed the Bloomberg US Aggregate Bond Index (Agg) and the Bloomberg US Treasury Index the 12 months following the first rate cut by an average of 3.25% and 4.33%, respectively. And with only 11 investment-grade corporate bond defaults in 25 years, these higher returns have historically come with low levels of risk that rival that of government securities.

Performance of CDs After Rates Peak
While certificate of deposit (CD) rates have dramatically risen since early 2022, history has shown they decline just as rapidly. In the six times since 1984 when CD rates peaked, returns have declined in the following year by an average of 28%. During these periods, many corporate fixed-income sectors have outperformed CDs by a wide margin.

Yields: Fixed Income Now Well Above Equities
With today’s fixed-income yields being at higher levels than in recent years, they can offer equity-like returns without the extra volatility of equities. Over the past 25 years, equities have had a higher return, but this also came with much more volatility. Now with fixed-income yields at their current levels, investors may be able to capitalize on higher returns at lower levels of risk.

Bank Loans vs. The Agg
While some investors think bank loans only do well when risk assets have rallied, historically the asset class has outperformed the Bloomberg US Aggregate Bond Index (Agg) in good times and bad. Looking at rolling two-year returns after the Global Financial Crisis of 2007-2008, when the Agg has returned 0% or less or 5.1% or more, bank loans have outperformed the index by an average of 9.30% and 1.03%, respectively. And when returns for the Agg were between 0.01% to 3.0%, bank loans have also outperformed the index by 3.74%.

Why Short-Term Credit
Some investors have shifted to longer-duration fixed income in hopes of capitalizing on a potential market downturn, but shorter duration credit has outperformed the Bloomberg US Aggregate Bond Index so far this year as economic growth has been resilient. For advisors ready to move beyond cash, short-term credit may present a compelling opportunity. A slight extension in duration may help reduce the reinvestment risk of cash while providing some diversification to riskier assets and similar yield than longer-duration fixed income.

Duration and Investment-Grade Bonds
Historically, investment-grade corporate bonds have carried a longer duration (6.2 years) than the Bloomberg US Aggregate Bond Index (5 years). The majority of that 24% increase in duration has come from lower-quality investment-grade tranches and not from higher-quality names included in the Agg. Currently, 43% of the duration of investment-grade corporate bonds comes from BBB credits vs. just 14% for the Bloomberg US Aggregate Bond Index. Investors interested in adding duration may want to look at their asset-class makeup to see where the duration is coming from.

The Risks of CDs
Certificate of deposits (CDs) don’t carry many of the traditional risks of fixed income, but they do have some, including:
- Less Purchasing Power: CDs do not adjust to increases in interest rates and inflation like some areas of fixed income, which leads to less real-purchasing power for investors.
- No Capital Appreciation: While some areas of fixed income will see price increases when interest rates fall, CD investors do not benefit from capital appreciation.
- Lack of Liquidity: While some CDs offer an out for investors, to do so does incur a stiff penalty for investors to access their cash.
- Lower Returns: Historically, when CD rates have been high, corporate bond yields have been even higher.

How Corporate Bonds Fared in Best, Worst Years
While many investors have sought safety in the Bloomberg US Aggregate Bond Index (Agg) in difficult times, others have fled broad investment-grade bonds during risk-on and rising interest-rate environments. Looking at the five best and five worst annual returns of the Agg since 1991, intermediate investment-grade corporate bonds and high-yield bonds have performed about as well or better than broad investment-grade bonds.

The Shift in Risk Profile of Bank Loans
While some investors may dwell on their experience in the bank-loan market during the Global Financial Crisis of 2007-2009, the loan market today, as measured by the Credit Suisse Leverage Loan Index, contains larger, more liquid issues, as well as fewer below investment-grade companies.

Active vs. Passive Fixed-Income Management
While taxable fixed-income flows have dramatically favored passive-based strategies over the past 12 months ($228 billion have flowed into passive fixed income vs. $33 billion for active fixed income), given the 147 basis points of outperformance by active fixed income over the period, investors have left quite a bit of money on the table in the amount of $3.36 billion. Then when you go back over the past three years, investors have also lost almost four times more in passive fixed-income strategies. In dollars, passive fixed-income investors have lost almost $10.71 billion more due to their choice of selecting a passive fixed-income option over an active fixed-income solution. While investors might be choosing passive fixed-income strategies due to their less expensive price tag, this might be costing investors quite a bit more in the long run if this return pattern continues.

Investment-Grade Corporate Bonds Present Opportunity
Investment-grade corporate bonds have historically compensated investors for the additional default risk relative to other investment-grade fixed-income sectors as shown by the option-adjusted spread. Even in difficult times, the worst-case scenario of a company default has rarely occurred in investment-grade corporate bonds. The asset class had only 11 defaults over the past 25 years, despite averaging 5,127 issues over the same period.

High-Yield Spreads Towering Over Default Rates
Credit spreads exist to compensate investors for the extra risk they are taking in purchasing a credit-risky bond over a risk-free bond. One might assume that the average credit spread should be similar to the average default rates because default risk along with downgrade risk is what investors are getting paid for. History shows that this is not the case in the high-yield market. When looking at average credit spreads over the past 25 years, one can observe that the average BB, B and CCC spreads are all comfortably above their respective average default rates (by rating 12 months prior to default) of the past 25 years. This makes the case that investors are getting compensated above what they should be for the default risk.

Is Now the Time to Rethink Fixed-Income Core?
Since 1976, intermediate core bond funds that closely followed the Bloomberg US Aggregate Bond Index underperformed compared to more versatile intermediate core-plus bond funds. Intermediate core plus bond funds generated 17.5% more growth since 1976, and over the past 20 years, generated a higher return, higher risk-adjusted returns, a lower drawdown in difficult times, and better up/down capture ratios relative to the Bloomberg US Aggregate Bond Index. This can be attributed to intermediate core plus bond funds greater tendency to invest in spread sectors and non-investment-grade fixed income, hence the reason “plus” was added to the naming convention of the Morningstar category.

Positive History for Fixed Income
Since 1976, the Bloomberg Aggregate Bond Index has had its fill of intra-year declines, but it still has managed to finish the year in positive territory the majority of the time. Since the inception of the index, history shows that bear markets for bonds are not as steep as some may make it out to be, as the average calendar year drawdown is just 2.6% per year vs. an average decline in equities of 14.2%. Further, following bad years of performance, bonds have historically tended to deliver strong results.

IG Credit, the Agg and Outperformance
Since 1990, the Bloomberg US Aggregate Bond Index (Agg) has outperformed intermediate investment-grade corporate bonds in 12 of the 33 years. In the year after the corporate bonds’ underperformance, the asset class has outperformed the Agg in 9 of the 12 instances by an average of 1.16%. If investors turn to the Agg for lower risk, they may risk missing out on a quick recovery of corporate bonds.

Catching Up With IG Corporate Bonds
Historic negative returns for the Bloomberg US Aggregate Bond Index (Agg) have left investors with a 3-year cumulative return of -11.14% vs. -4.44% for intermediate investment-grade corporate bonds. To make up for the Agg’s losses, the index would need to produce a return of 12.53%, but that number falls to just 4.65% for the corporate bonds. Over the past 30 years the Agg has only produced a calendar year return greater than 12.53% once (or 3.3% of the time). On the other hand, intermediate investment-grade corporate bonds have produced a calendar year return of 4.65% or greater (50% of the time).

IG Returns Amid Falling Interest Rates
While some investors—uncertain about the Federal Reserve’s next moves—have recently migrated to the low risk of money-market funds or short-term bond funds, they may miss out if interest rates start to decline. With their added duration, intermediate-term fixed-income funds have historically provided more upside potential than money-market funds or short-term bond funds when rates start to drop.

High-Yield Bonds: Returns, Volatility and Risk
Over the past three years, high-yield bonds have outperformed the Bloomberg US Aggregate Bond Index, global bonds and emerging-market debt. During the same period, volatility for high-yield bonds has been below average compared to the asset class’s 20-year average (trailing 3-year standard deviation finished January 2024 at 8.36 vs. 9.13 for the 20-year average). Also, compared to global bonds and emerging-market debt—other asset classes investors turn to for yield—high-yield bonds have seen subdued levels of volatility over the past three years. While some investors may be concerned about a pickup in default activity for high-yield bonds, this increase has been mostly seen in lower quality bonds, which make up just 13.2% of the asset class.

Corporate Bonds vs. Diversified Bond Portfolio
When looking back at how corporate bonds and an equally weighted corporate-bond portfolio would have done over rolling 3-year periods since 1994, the balanced portfolio would’ve generated 20% more return with only 2% more volatility. More importantly, broad investment-grade bonds have significantly underperformed corporate bonds in difficult periods for investors. For example, a diversified portfolio of corporate bonds would’ve protected investor portfolios better over the 15 years since the Global Financial Crisis (2007-2009) vs. the 15 years prior to the Global Financial Crisis.

What Happened During the Last Soft Landing?
The last time the economy had a soft landing after a Federal Reserve rate-hiking cycle occurred in 1995. In the nearly four years after the end of that rate hiking cycle when the Fed held rates relatively stable, investment-grade corporate bonds outperformed many fixed-income asset classes. The Fed’s current hiking cycle, which to date has closely paralleled the one in the mid-1990s, may have the economy coming in for a similar soft landing. If the economy continues on this path, corporate credit may be an attractive option for investors who are looking to find more yield.

The March Toward Added Duration
While intermediate-term fixed-income funds saw approximately $186 billion in inflows in 2023, this was dwarfed by the $959 billion of inflows into money-market funds (a 24% increase from 2022). With money-market fund assets under management (AUM) near historic levels, could fixed income see a wave of inflows into duration in 2024 in anticipation of the Federal Reserve potentially cutting rates?

Completing the IG Total-Return Equation
While yield levels remain elevated across fixed-income asset classes, investment-grade corporate bonds may have some price appreciation left for 2024. Historically1, when investment-grade corporate bond yields have been within 25 basis points or 50 basis points of current levels, the average price of the asset class has been 8.7% and 9.0% higher, respectively, than current levels, completing the other half of the total-return equation.

Can BBB Yields Make Up for Agg Losses?
Despite a rally last year in fixed income, many investors may find themselves in a hole when it comes to their core fixed-income position with the total return for the Bloomberg US Aggregate Bond index over the past three years at -9.62%. When you back out yield and just look at price return, those returns fall to -16.70%. Though the index yield still sits near a multi-decade high of 4.53%, it could take over two years for investors to see positive returns on core fixed-income positions added three years go. On the other hand, BBB investment-grade corporate bonds could help shorten that breakeven period, as BBB corporates started the year with a yield of 5.28%.
Past performance does not guarantee future results. Investing involves risk, including loss of principal.
Investors should consider a fund’s investment goal, risks, charges, and expenses carefully before investing. The prospectuses and/or summary prospectuses contain his and other information and should be read carefully before investing. The prospectuses can be obtained by visiting AristotleFunds.com.
Foreside Financial Services, LLC, distributor.

The Resiliency of Bank Loans
The common perception of many investors is that bank loans (or floating-rate loans) only outperform in periods of rising rates. A less frequently discussed topic is how the asset class performs in periods of flat and declining rate environments.

How IG Bonds Have Fared Compared to a Diversified Bond Index
With investment-grade corporate bonds, investors might have the opportunity to capture higher yields and potential excess return compared to a diversified bond index. Since 1981, the Bloomberg US Corporate Investment Grade Index has generated:
• A higher 3-year rolling return than the Bloomberg US Aggregate Bond Index 77.5% of the time.
• Seven periods of a 3-year rolling return greater than 19% compared to just two from the Bloomberg US Aggregate Bond Index.
• Only four periods of a 3-year rolling return less than -1% compared to six periods from the Bloomberg US Aggregate Bond Index.

What Might Happen if the Fed Lowers Rates?
Bond prices have an inverse relationship to yield: When yield or interest rates increase or decrease, bond prices move in the other direction. By looking at the duration of an asset class, you can potentially estimate how much bond prices might move for every 1% shift in interest rates. Then you could add in the current yield to estimate the potential 12-month return. With the Federal Reserve now on pause, and the market likely anticipating rate cuts in 2024, here is a look at what the potential return might be for specific investment-grade fixed-income asset classes based off current duration and yield levels if the Fed decreased interest rates by 1%.

How Did Intermediate IG Bonds Perform After the Fed's Last Pause in 2018?
In the 12 months following the Federal Reserve’s last rate hike in December 2018, intermediate investment-grade corporate bonds outperformed the Bloomberg US Aggregate Bond Index by 1.42%. In addition to the higher returns, intermediate investment-grade corporate bonds also generated during this period 28% less volatility than the Bloomberg US Aggregate Bond Index; 57% less max drawdown than the Bloomberg US Aggregate Bond Index; and higher returns in the best and worst quarter than the Bloomberg US Aggregate Bond Index.

Why Now May Be the Time for Tax-Loss Harvesting
Since most fixed-income funds distribute the majority of their return in the form of monthly distributions, their price return is usually well below the total return. For example, the Bloomberg US Aggregate Bond Index has generated a price return of -2.67% over the trailing 12 months and -11.74% over the past five years. On the other hand, the total return for the index (adding distributions and capital gains) was 0.64% for the trailing 12 months and 0.51% for the past five years. Knowing this, investors may want to take advantage of the current environment and consider tax-loss harvesting their fixed-income losses from what have historically been considered conservative investment options.

Not All Yield Comes With Large Volatility
Historically, higher levels of yield meant higher levels of volatility. However, this has not been the case with bank loans. Over the past three years, bank loans have had lower levels of volatility with higher levels of yield compared to most investment-grade, fixed-income asset classes.

The Spike in Personal Savings Has Disappeared
Thanks to the COVID relief programs, personal savings soared in 2020 and 2021, peaking at $6.5 trillion (about a 364% increase from historical levels). But over the past two years, those excess savings—which many have credited with helping keep the economy strong—have been spent.

After a Hiking Cycle, Longer Duration Has Historically Outperformed Shorter Duration
Historically, intermediate core plus bond funds have significantly outperformed money market and ultra short bond funds in the 12 months following a Federal Reserve hiking cycle, as longer duration bond investors have benefited from higher yields and more attractive relative value. While investors have added $614.1 billion to money market funds so far in 2023, there may be a better investment opportunity with longer duration assets should the Federal Reserve decide to take a pause in the current rate hiking cycle.

How Corporate Debt Performed Last Hiking Cycle
Corporate debt had strong returns during the previous Federal Reserve rate-hike cycle ending in 2018, continued to have strong returns through the pause, and outperformed other asset classes through the full cycle.

Why Duration After a Rate-Hiking Cycle Ends
Historically, when a Federal Reserve rate-hiking cycle has ended, longer-duration spread sectors have materially outperformed more traditional fixed-income and shorter-duration spread sectors in the following 12 months.

Yields Across Corporate Credit Have Been Rising
Yields across corporate credit are currently far higher than at the end of 2021. In this environment, the additional credit risk may be worth the additional yield for investors.

What Happened After Fed Last Paused Rate Hikes?
The Federal Reserve has predicted it will raise interest rates two more times in 2023. But current market expectations are for a rate pause for the rest of the year. Here's what happened the last time the Fed paused rates.

Year-Over-Year Consumer Spending Trends
Consumer spending has been slightly up year-over-year (as of July 22, 2023), according to Bank of America credit-card spending data. While spending was significantly down in categories such as online electronics, furniture and gas, consumers have been paying more on dining and entertainment.

Yield, Volatility and Bank Loans
Historically, if investors wanted higher levels of yield, they would have to take on higher levels of volatility. But over the past three-plus years, bank loans have had lower levels of volatility than most investment-grade areas of the fixed-income market with higher levels of yield. Bank loans currently offer investors more than two times the yield of the Bloomberg US Aggregate Bond Index, while having delivered 50% less volatility over the past three years.

Longer Duration, Smaller Yield so far in 2023
Over the past 12 months, longer-duration asset classes have seen $99.4 billion in net inflows vs. $22.8 billion in outflows from shorter-duration categories.1 To date, this move to duration—sparked largely by the potential ending of rate hikes by the Fed—has seen bank-loan funds outperform long government bond, intermediate core bond and intermediate government bond funds in the second half of 2022, all of 2022 and 2023 year-to-date.

Yields Across Corporate Credit Have Been Rising
With yields across corporate credit currently far higher than at the end of 2021, investors may now assess whether additional credit risk has been worth the extra pickup in yield.

Duration, Yield and Fed Expectations
Some investors have started to add duration to their fixed-income investments, expecting a Federal Reserve pause in interest-rate hikes. But given the current curve inversion across various areas of fixed income, investors have been giving up yield for the sake of adding duration. With the Fed still reiterating a data-dependent approach, investors may be caught off guard if the Fed continues to raise rates without a pause.

Is it Time to Revisit Bank Loans?
In 2022, investors had few places to hide amid one of the worst market years on record. But one fixed-income asset class performed far better than others: Bank loans.

Short-Term vs. Intermediate Core Bonds
Fixed-income investors in intermediate core bond funds gave back 105% and 71% of their 5-year and 10-year return, respectively, in 2022. Investors who added exposure to short-term bond funds fared better; the average short-term bond fund finished 2022 with a return of -5.22% vs. -13.32% for the average intermediate core bond fund. This was the greatest margin of outperformance for short-term bond funds over intermediate core bond funds since the inception of the Morningstar Short Term Bond Category.

How Have Bank Loans Performed in Down Years?
In 2022, investors had few places to hide amid one of the worst market years on record. But one fixed-income asset class performed far better than others: Bank loans.