
August 2026
The Cost of Computation
Download PDFWe recently sat down with Dominic Nolan, CEO of Aristotle Pacific Capital, to discuss the economy and markets, along with a special look at the wider implications of extreme capital spending to develop artificial intelligence. We conclude with a personal reflection.
Market Performance
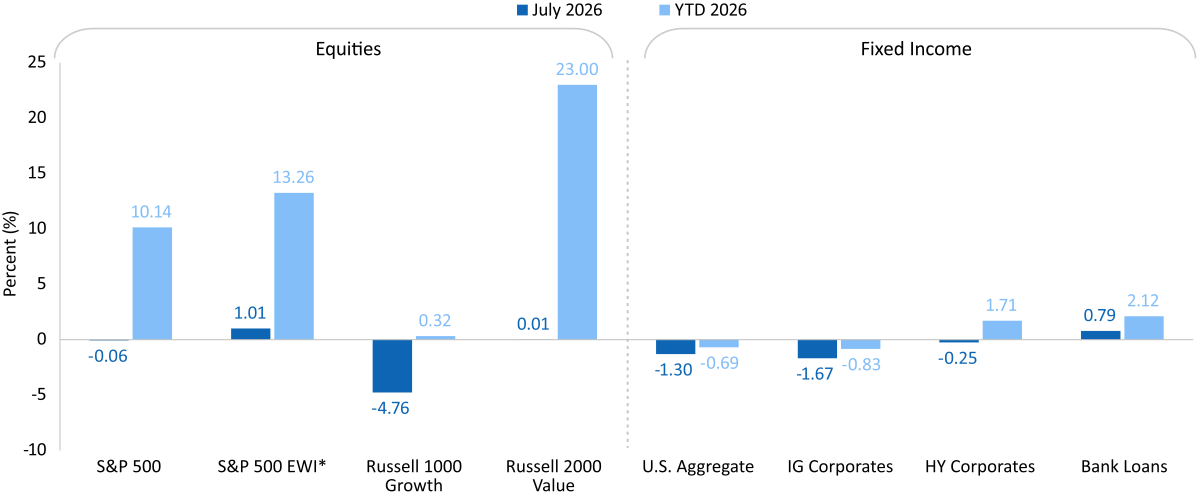
Market performance was mixed in July. What happened?
Mixed is an apt description. The S&P 500 Index was close to flat last month, down 6 basis points (bps), though it’s up ~10% year to date. Meanwhile, the S&P 500 Equal Weight Index gained 1% in July and is up more than 13% year to date. The contrast is starker between growth and value. The Russell 1000 Growth Index declined nearly 5% in July and is up just 32 bps so far this year, while the Russell 2000 Value Index gained 1 bp last month and is the standout year to date, with a 23% return. Value has essentially been catching up after periods of underperformance. The mixed market performance also reflects a confluence of headwinds even as the economy continues to expand, including the resurgence of tensions with Iran, persistent inflation, and hawkish Federal Reserve rhetoric.
These factors also pushed up bond yields, weighing on both bonds and equities. The Bloomberg U.S. Aggregate Bond Index declined 1.3% in July. Bank loans, however, outperformed both the Agg and the S&P 500, returning 79 bps last month.
Mag 7 (& Co.)
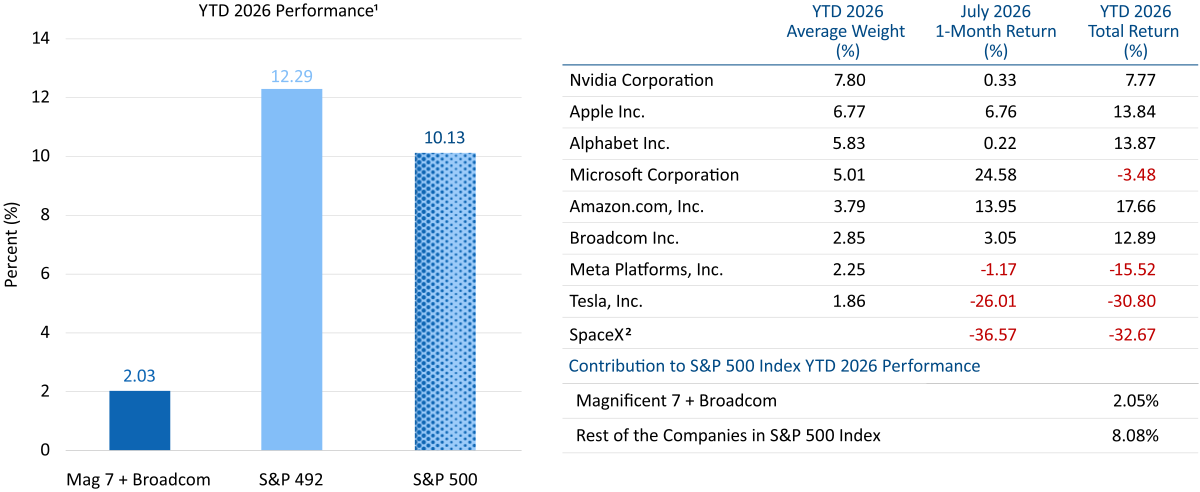
How did our Mag 8 compare to the market?
Our Mag 8 experienced wider dispersion than the leading indexes. Microsoft led the group, returning 24.6% in July after beating second-quarter revenue and operating income forecasts. The company also reported a 43% increase in Azure revenue and an increase in paid users of Copilot, which includes AI features. The increase in paid Copilot users was likely the icing on the cake for investors; the market overall has been expressing skepticism about AI spending across the Mag 8, which we will discuss later. For example, although Meta beat revenue estimates for the second quarter, its stock fell about 1% last month as the company raised the estimated floor for 2026. As we have mentioned before, the other 492 companies in the S&P 500 have been driving performance lately; in July, they accounted for about 8 percentage points of the index’s 10.1% return year to date, with the Mag 8 contributing the other roughly 2 percentage points.
And although SpaceX is not in the Mag 8, it is certainly worth mentioning. Its stock declined 36.6% in July, erasing hundreds of billions of dollars in market capitalization.
U.S. Treasury Yield Curve Range
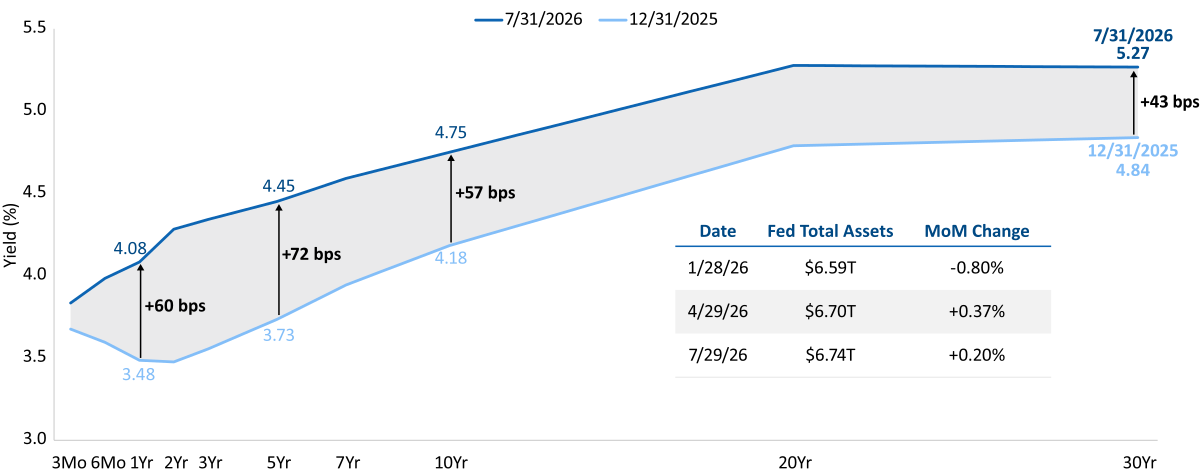
U.S. Treasury yields rose across the curve in July. What drove the move higher?
The combination of elevated inflation and renewed tensions around the Strait of Hormuz drove yields higher. The 10-year Treasury, for example, started the month at 4.48% and ended it at 4.75%. The rise in two-year yields reflected the potential for Fed rate hikes. We entered the year expecting global central banks to cut rates; instead, rate hikes are on the table in Japan, the U.S., and the U.K.
Markets swooned in response to Kevin Warsh's FOMC press conference. Any feedback you'd give to the new Fed chair?
I think the jury is still out on him. Initially, he and the Fed expressed tough rhetoric on inflation, but when questioned, Warsh has offered few details regarding what the Fed intends to do. He also appears to be resisting transparency. The combination of less transparency, few details on action, and tough rhetoric reminds me of the quote, “all hat, no cattle.” Again, the jury is still out.
Economic Dashboard
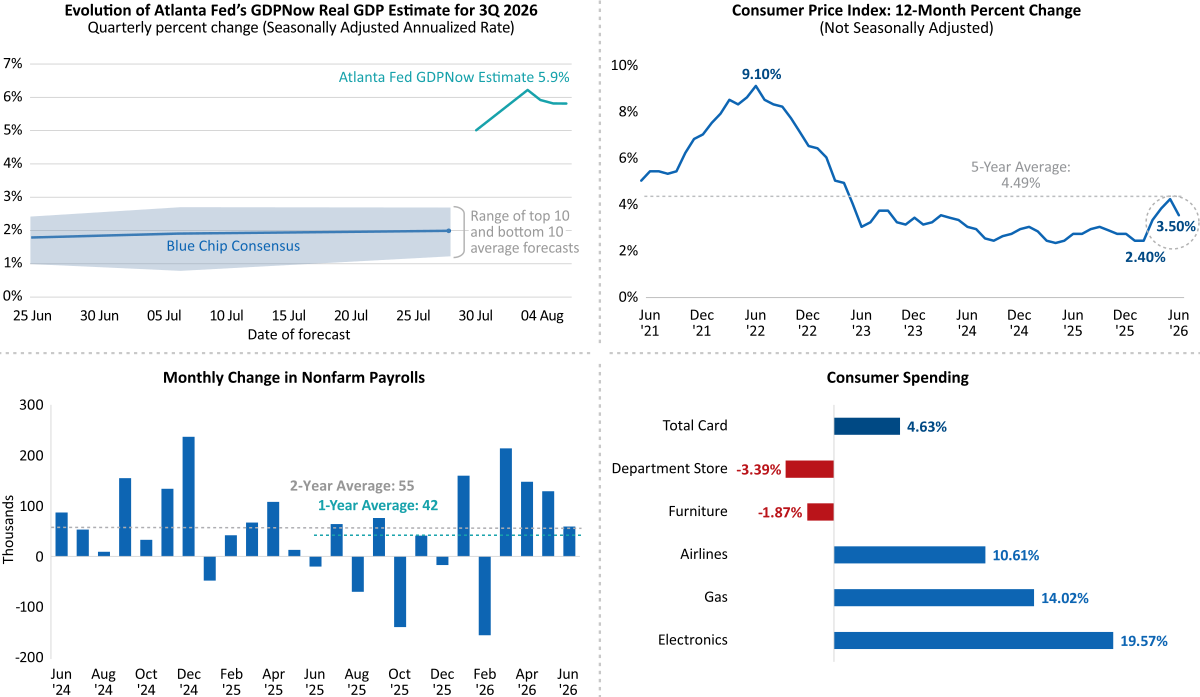
What does the current data tell us about the U.S. economy?
The economy seems to be chugging along. U.S. real GDP expanded in the 1% to 2% range in the first half of the year, with nominal GDP several points higher. That’s decent economic performance. Corporate earnings are reported in nominal terms, and earnings growth of 6% to 7% is in line with the rate of nominal GDP expansion. Yet there are signs of economic cooling. Inflation eased in June, and nonfarm payrolls have been trending down; they decreased by 23,000 in July, and the totals for May and June were revised lower. The unemployment rate fell to 4.1% in July as labor force participation continued to dip. If these trends continue, the Fed will have room to remain on hold.
From Server Rooms to AI Factories
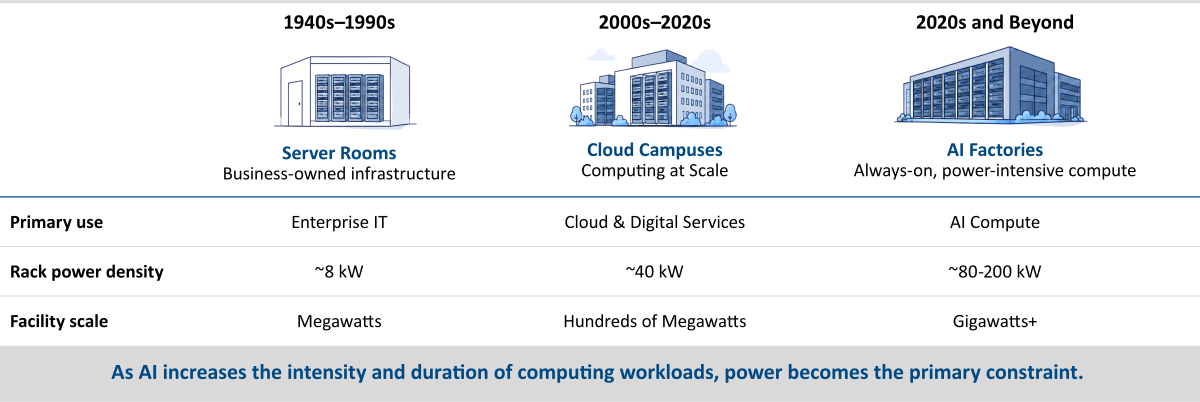
Let’s shift to our special topic: the current state of computing capacity and the implications of robust AI infrastructure spending. To start, what is a data center?
A data center is a physical facility, often a campus of buildings, that houses computer servers for computing and data storage. Going back to the early days of computers in the 1940s, public and private institutions had their own server rooms to meet enterprise-wide computing needs. Then, beginning roughly in the 2000s, some companies built separate facilities to house servers and offer cloud computing to others. Energy consumption for computing at these sites increased, though it remained in the megawatt range. With the dawn of AI in the 2020s, modern freestanding campuses can require gigawatts of power to operate. That’s equivalent to going from powering enough lightbulbs for a neighborhood street in the old server-room days to powering enough lightbulbs to illuminate a small city today. It’s a massive increase in energy usage.
AI Data Center Supply Is Tightening
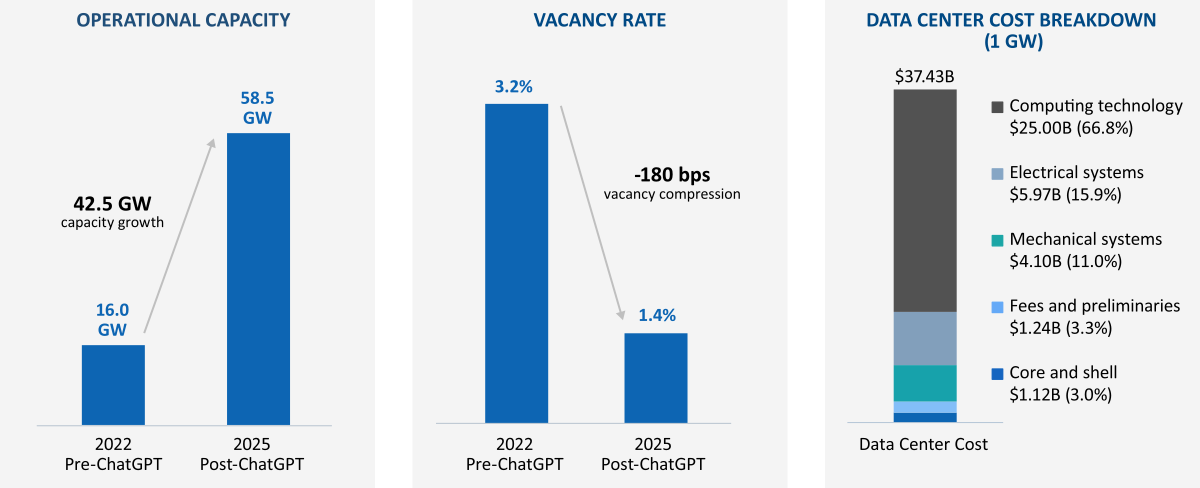
What is the current state of data center capacity?
ChatGPT was released in November 2022, and that year data centers totaled 16 GW of operational capacity in North America. By the end of 2025, capacity had more than tripled to 58.5 GW. Data center vacancy rates, already low at 3.2% in 2022, declined to 1.4% over the same period. Essentially, there is no vacancy today, and demand keeps growing.
However, meeting that demand is extremely costly. Every gigawatt of data center capacity costs about $37 billion to develop, including about $25 billion for computing technology, $6 billion for electrical systems, and $4 billion for mechanical systems, with other costs making up the difference. To meet some demand forecasts, gigawatt capacity would have to double in the next four years; that could cost around $2 trillion.
The Cost of Intelligence Has Collapsed
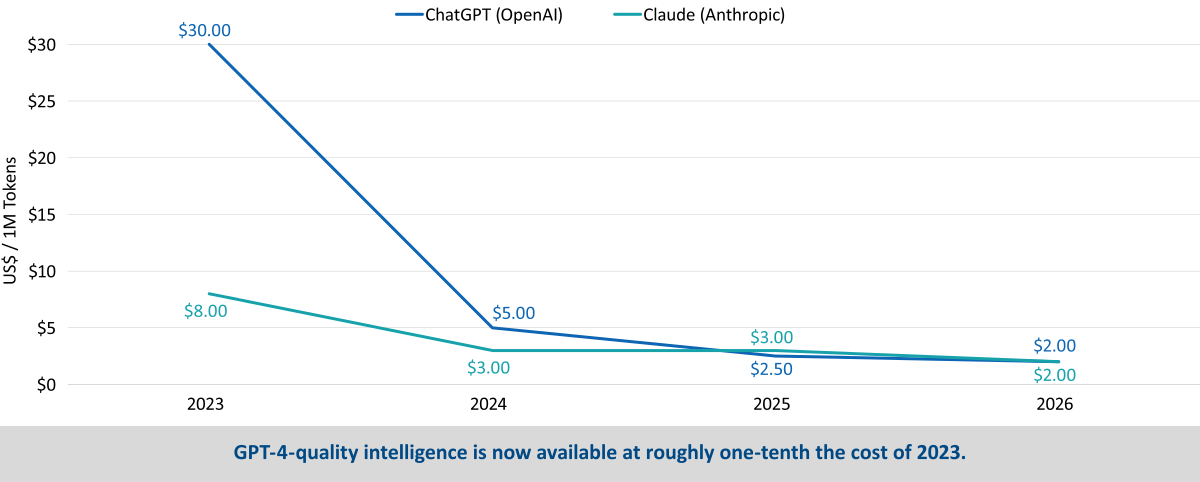
If it costs close to $40 billion to build 1 GW worth of data center capacity, how does the revenue make sense?
Since OpenAI and Anthropic are privately owned, we don’t have a crystal-clear picture of their finances. However, recent press reports have pegged OpenAI at about $25 billion in annual revenue and Anthropic at close to $50 billion. Anthropic’s revenue growth has been incredible: in late 2024, its annual revenue was reportedly $1 billion.
So, while data centers are expensive to build, the leading AI companies appear to be growing revenue at impressive rates. We should get greater clarity on their profitability as they proceed to IPOs.
Flagship AI Token Prices, 2022–2026
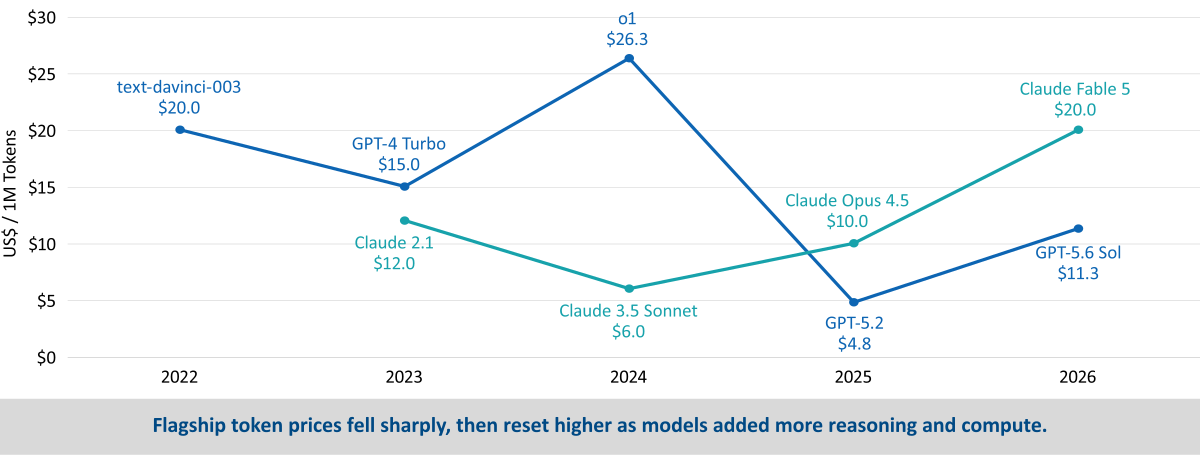
How does the pricing work across the different models?
Many people have used either ChatGPT or Claude. In 2023, OpenAI, which owns ChatGPT, charged enterprise customers about $30 per 1 million input tokens for GPT-4-level performance, while Anthropic, which owns Claude, charged about $8 per 1 million input tokens for a model with similar performance. Today, both companies charge about $2 for a similar-level model; thus, per-token pricing has dropped dramatically for older models. A token equals about four characters of text, so a short sentence is roughly four to five tokens. Input pricing reflects what users enter, while output pricing, which can be four or five times higher, reflects the computing power the models use.
However, newer models can cost significantly more. For example, we looked at a blend of 75% input and 25% output pricing across models and found that Anthropic charges about $20 per 1 million text tokens for Claude Fable 5, a newer model, but only $6 for Claude 3.5 Sonnet. There have been stories of engineers doing extensive work on newer Claude models and running up multimillion-dollar bills for their employers. These are still early days, and such revenue anecdotes can make the AI market seem like the Wild West.
Hyperscalers and Their Investments
How has hyperscaler debt issuance changed the complexion of the bond market?
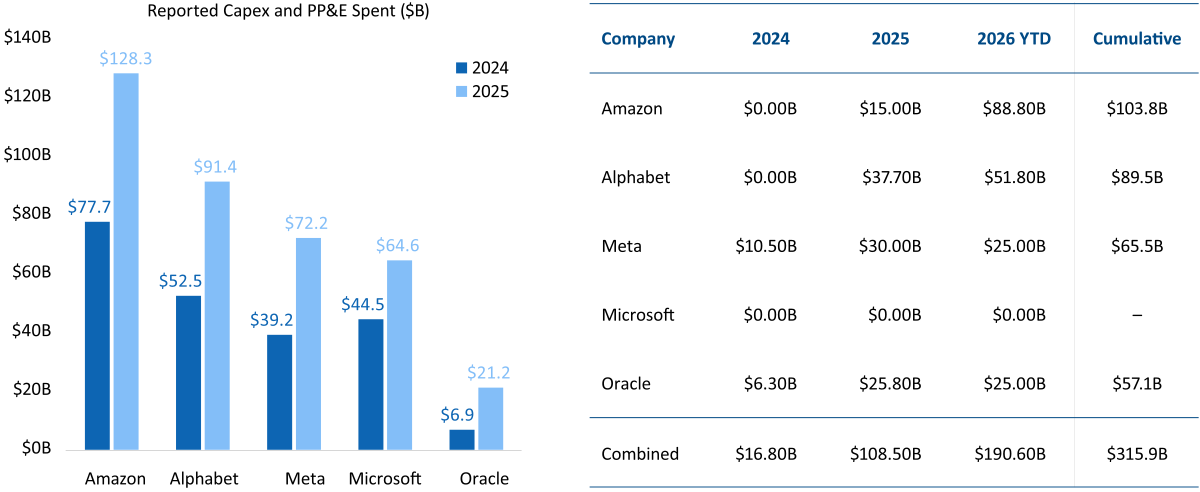
They've become a meaningful sector within the bond market. Our investment team recently noted that hyperscaler debt as a share of the U.S. investment-grade bond market has risen to weighting comparable to financial companies, historically the largest IG sector. Amazon issued about $15 billion in bonds in 2025 and has issued $88.8 billion so far in 2026. Alphabet is not far behind, with $37.7 billion in 2025 and $51.8 billion so far this year. Meta is third, with $30 billion and $25 billion over the same periods, though it also issued $10.5 billion in 2024. In all, we expect the group to issue $200 billion to $300 billion a year over the next few years.
Interestingly, Microsoft has not had to issue debt to fund tens of billions in capex because it generates so much cash. In fact, Microsoft’s S&P credit rating is AAA, higher than the rating on U.S. Treasuries. Alphabet is AA+, Amazon is AA, and Oracle’s debt rating has slid to BBB-, which is just above junk. Oracle is the most interesting one to watch. Its spreads are high, it has significant lease obligations, and depending on how those obligations are viewed, it could be seen as highly levered.
Thus, while hyperscaler issuance is large, it is also nuanced. These companies are not highly regulated like banks, so investors should do their credit homework.
Growing Public Scrutiny of Data Center Expansion
What are the broader impacts of the data-center buildout?
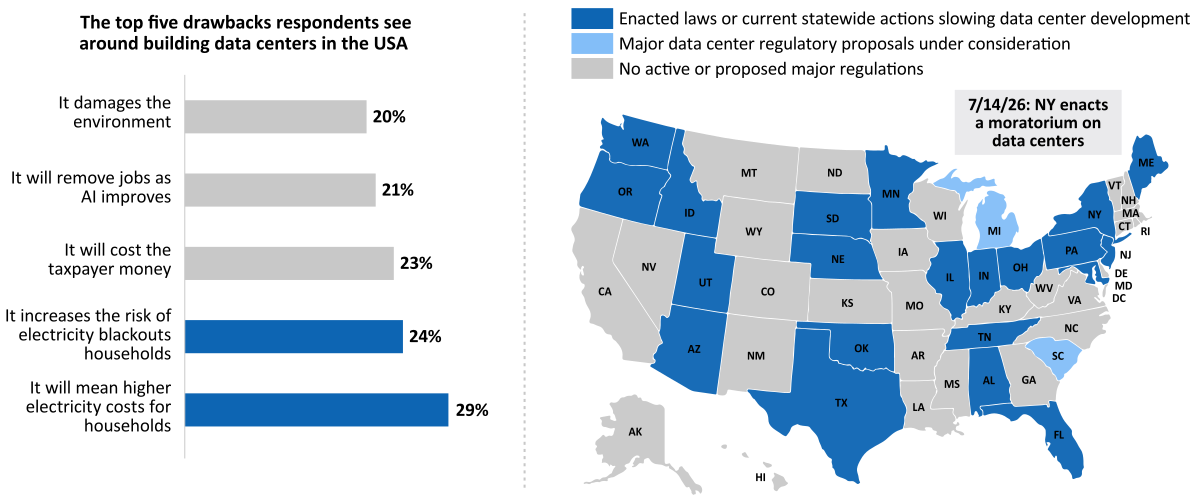
America is pushing back, and I can’t say the resistance is undeserved. Many states have considered pausing data center development, and at least 100 localities have approved a moratorium. The opposition is bipartisan. The most cited source of frustration is the potential for higher household electricity bills. In Henrico County, outside Richmond, Virginia, electricity bills for government and school facilities have reportedly increased 25% due to data centers in the area; Virginia has become a hub of data center development. Utilities certainly want to avoid raising household prices, as customers could revolt, but pushing costs onto public institutions will add expenses to likely already strained budgets and ultimately could be felt by taxpayers. Thus, I expect resistance to continue unless a greater supply of affordable energy becomes available where it is needed.
Power Wins
What are the economic and political implications if we don't build enough data storage capacity?
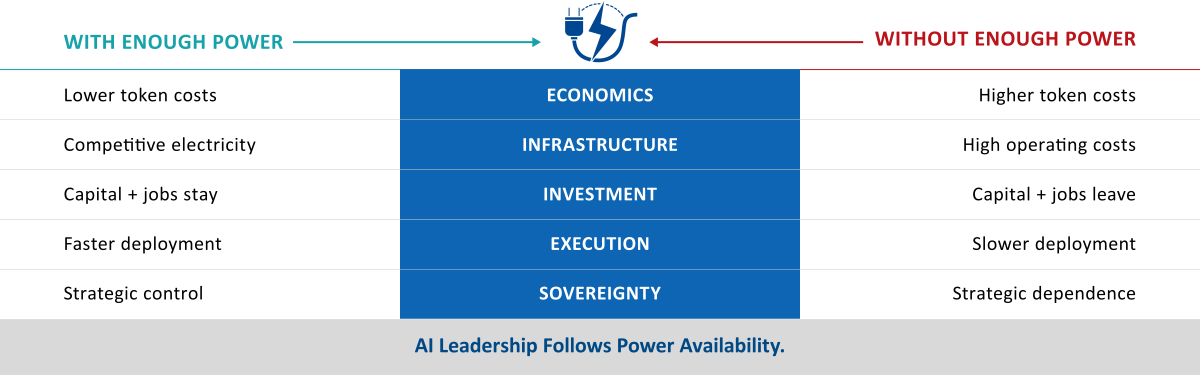
In a nutshell, power wins. We talked about the cost of compute. If we can generate enough power, the cost of tokens should, in theory, decline, which should improve economic productivity.
Still, some people may ask whether the cost is justified. Our nation’s prominence in the world has centered on the strength of its military, economy, and technology. I believe the third is critical to the first two: to have the strongest economy and military today, a nation needs the strongest technology. Artificial intelligence is at the center of modern technology and is transforming the country and the world. If we are not the leader in AI, someone else will be, and to be the leader, we need energy. Today, energy is a critical bottleneck to AI development. I believe we, as a country, need to be open to a serious expansion in power generation, whether from nuclear, solar, wind, or whatever else is required. With enough energy to power AI, we can win in technology and retain our leading role in the world. That’s my view, and I think it is shared by many in Washington.
Fixed Income Yields and Year-to-Date Returns
Let's talk bonds. Where are you seeing opportunities in fixed income today?
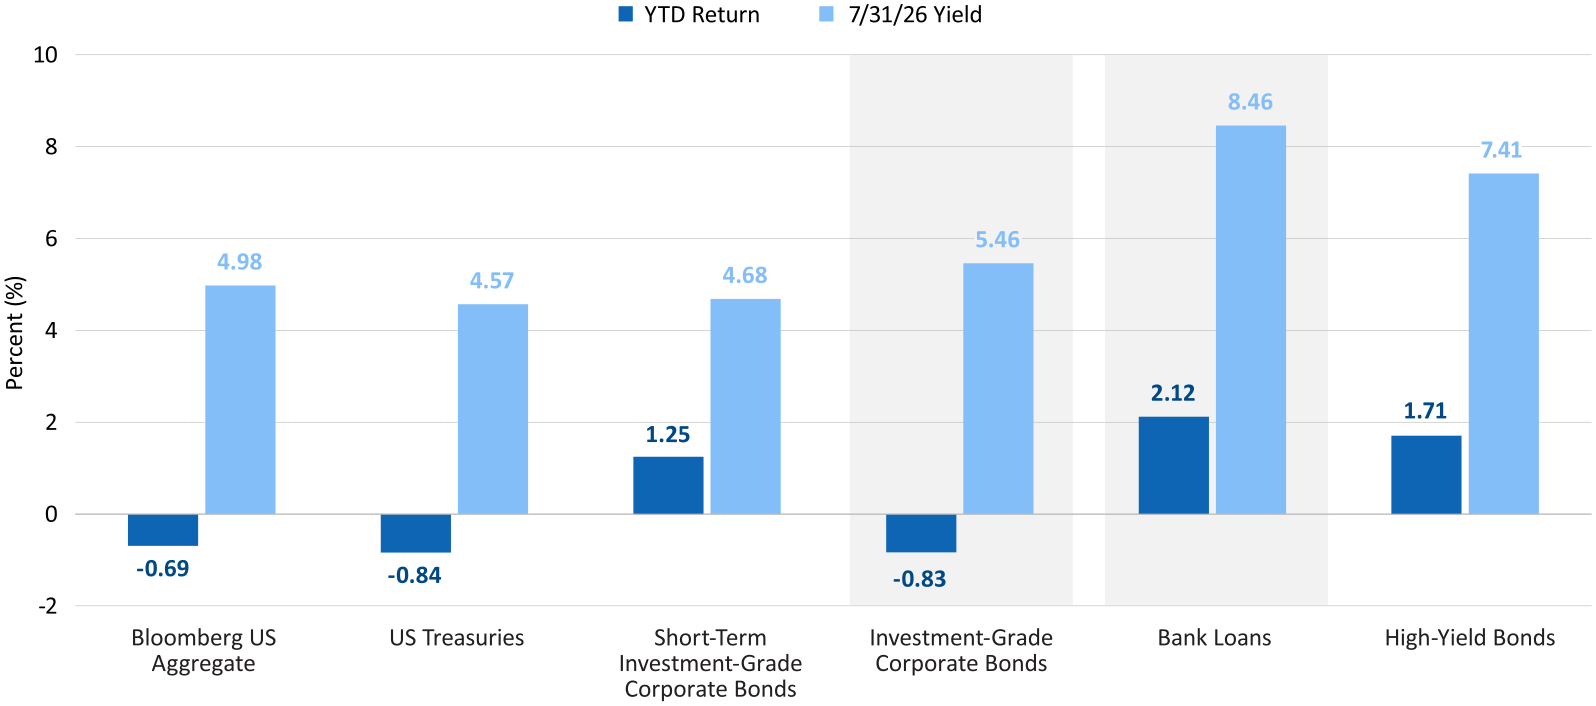
Yields are attractive, with the 10-year Treasury yield hovering in the high 4% range in recent weeks and investment-grade corporate bond yields in the mid-5% range. I see IG corporates as a compelling investment, given both the elevated yield and the potential for capital appreciation, as I believe inflation will decline. In my opinion, an IG allocation has the potential to deliver a high-single-digit total return over the next year or two.
In addition, bank loans are yielding around 8% these days, and they have been the best-performing fixed income asset class so far this year. We generally favor a bank loan allocation to account for interest rate volatility.
Let's close with a personal reflection.
I've noticed over the past month that many of my conversations with parents focus on what their kids are enduring. My response is, that’s good, because it toughens them. During a talk at the Stanford Institute for Economic Policy Research, Jensen Huang said, “Greatness is not intelligence. Greatness comes from character, and character isn’t formed out of smart people. It's formed out of people who suffered.” It sounds harsh, but today’s kids could probably use more suffering.
A 10-year Treasury note is a debt obligation issued by the United States government with a 10-year maturity period.
The Atlanta Fed GDPNow provides a running estimate of real GDP growth for the current quarter using available economic data.
Bank loans (or floating-rate loans) are financial instruments that pay a variable or floating interest rate. A floating rate fund invests in bonds and debt instruments whose interest payments fluctuate with an underlying interest-rate level.
A bond is a fixed-income instrument and investment product where individuals lend money to a government or company at a certain interest rate for an amount of time. The entity repays individuals with interest in addition to the original face value of the bond.
The Bloomberg US Aggregate Bond Index (Agg) is composed of investment-grade U.S. government bonds, invest-ment-grade corporate bonds, mortgage pass-through securities, and asset-backed securities, and is commonly used to track the performance of U.S. investment-grade bonds.
Capital Expenditure (CapEx) is the money a company spends to acquire, upgrade, or maintain long-term, physical assets.
Consumer Confidence measures consumers’ attitudes and optimism about the economy and their personal financial situation.
Coupon refers to the interest payment that a bond issuer promises to pay to a bondholder.
Fixed income refers to assets and securities that pay a set level of income to investors, typically in the form of fixed interest or dividends.
Investment grade refers to the quality of a company's credit. To be considered an investment grade issue, the company must be rated at 'BBB' or higher by Standard and Poor's or Moody's.
An investment-grade bond is a type of bond that is considered to have a relatively low risk of default.
The ISM Manufacturing Index is a monthly economic indicator published by the Institute for Supply Management (ISM) that gauges the health of the U.S. manufacturing sector.
Treasury rate (or yield) refers to the interest rate at which the U.S. government borrows money by issuing Treasury securities.
Yield is the income returned on an investment, such as the interest received from holding a security.
A yield curve plots the interest rates of bonds that have equal credit quality but different maturity dates.
Yield-to-Worst is the lowest potential yield that can be received on a bond without the issuer defaulting.
Any performance data quoted represents past performance, which does not guarantee future results. Index performance is not indicative of any fund’s performance. Indexes are unmanaged and it is not possible to invest directly in an index. For current standardized performance of the funds, please visit www.AristotleFunds.com.
The views expressed are as of the publication date and are presented for informational purposes only. These views should not be considered as investment advice, an endorsement of any security, mutual fund, sector or index, or to predict performance of any investment or market. Any forward-looking statements are not guaranteed. All material is compiled from sources believed to be reliable, but accuracy cannot be guaranteed. The opinions expressed herein are subject to change without notice as market and other conditions warrant.
Investors should consider a fund’s investment goal, risk, charges and expenses carefully before investing. The prospectus contains this and other information about the fund and can be obtained at www.AristotleFunds.com. It should be read carefully before investing.
Investing involves risk. Principal loss is possible.
A full list of holdings can be found at www.aristotlefunds.com and are subject to risk and to change at anytime. Any discussion of individual companies is not intended as a recommendation to buy, hold or sell securities issued by those companies.
Aristotle Funds and Foreside Financial Services, LLC are not affiliated with Pacific Life Fund Advisors LLC.
Foreside Financial Services, LLC, distributor.