
September 2026
Yielding Under Pressure
Download PDFWe recently sat down with Dominic Nolan, CEO of Aristotle Pacific Capital, to get his insights into the rise in global bond yields, the Fed’s next move, and opportunities in fixed income. We conclude with a personal reflection.
Market Performance
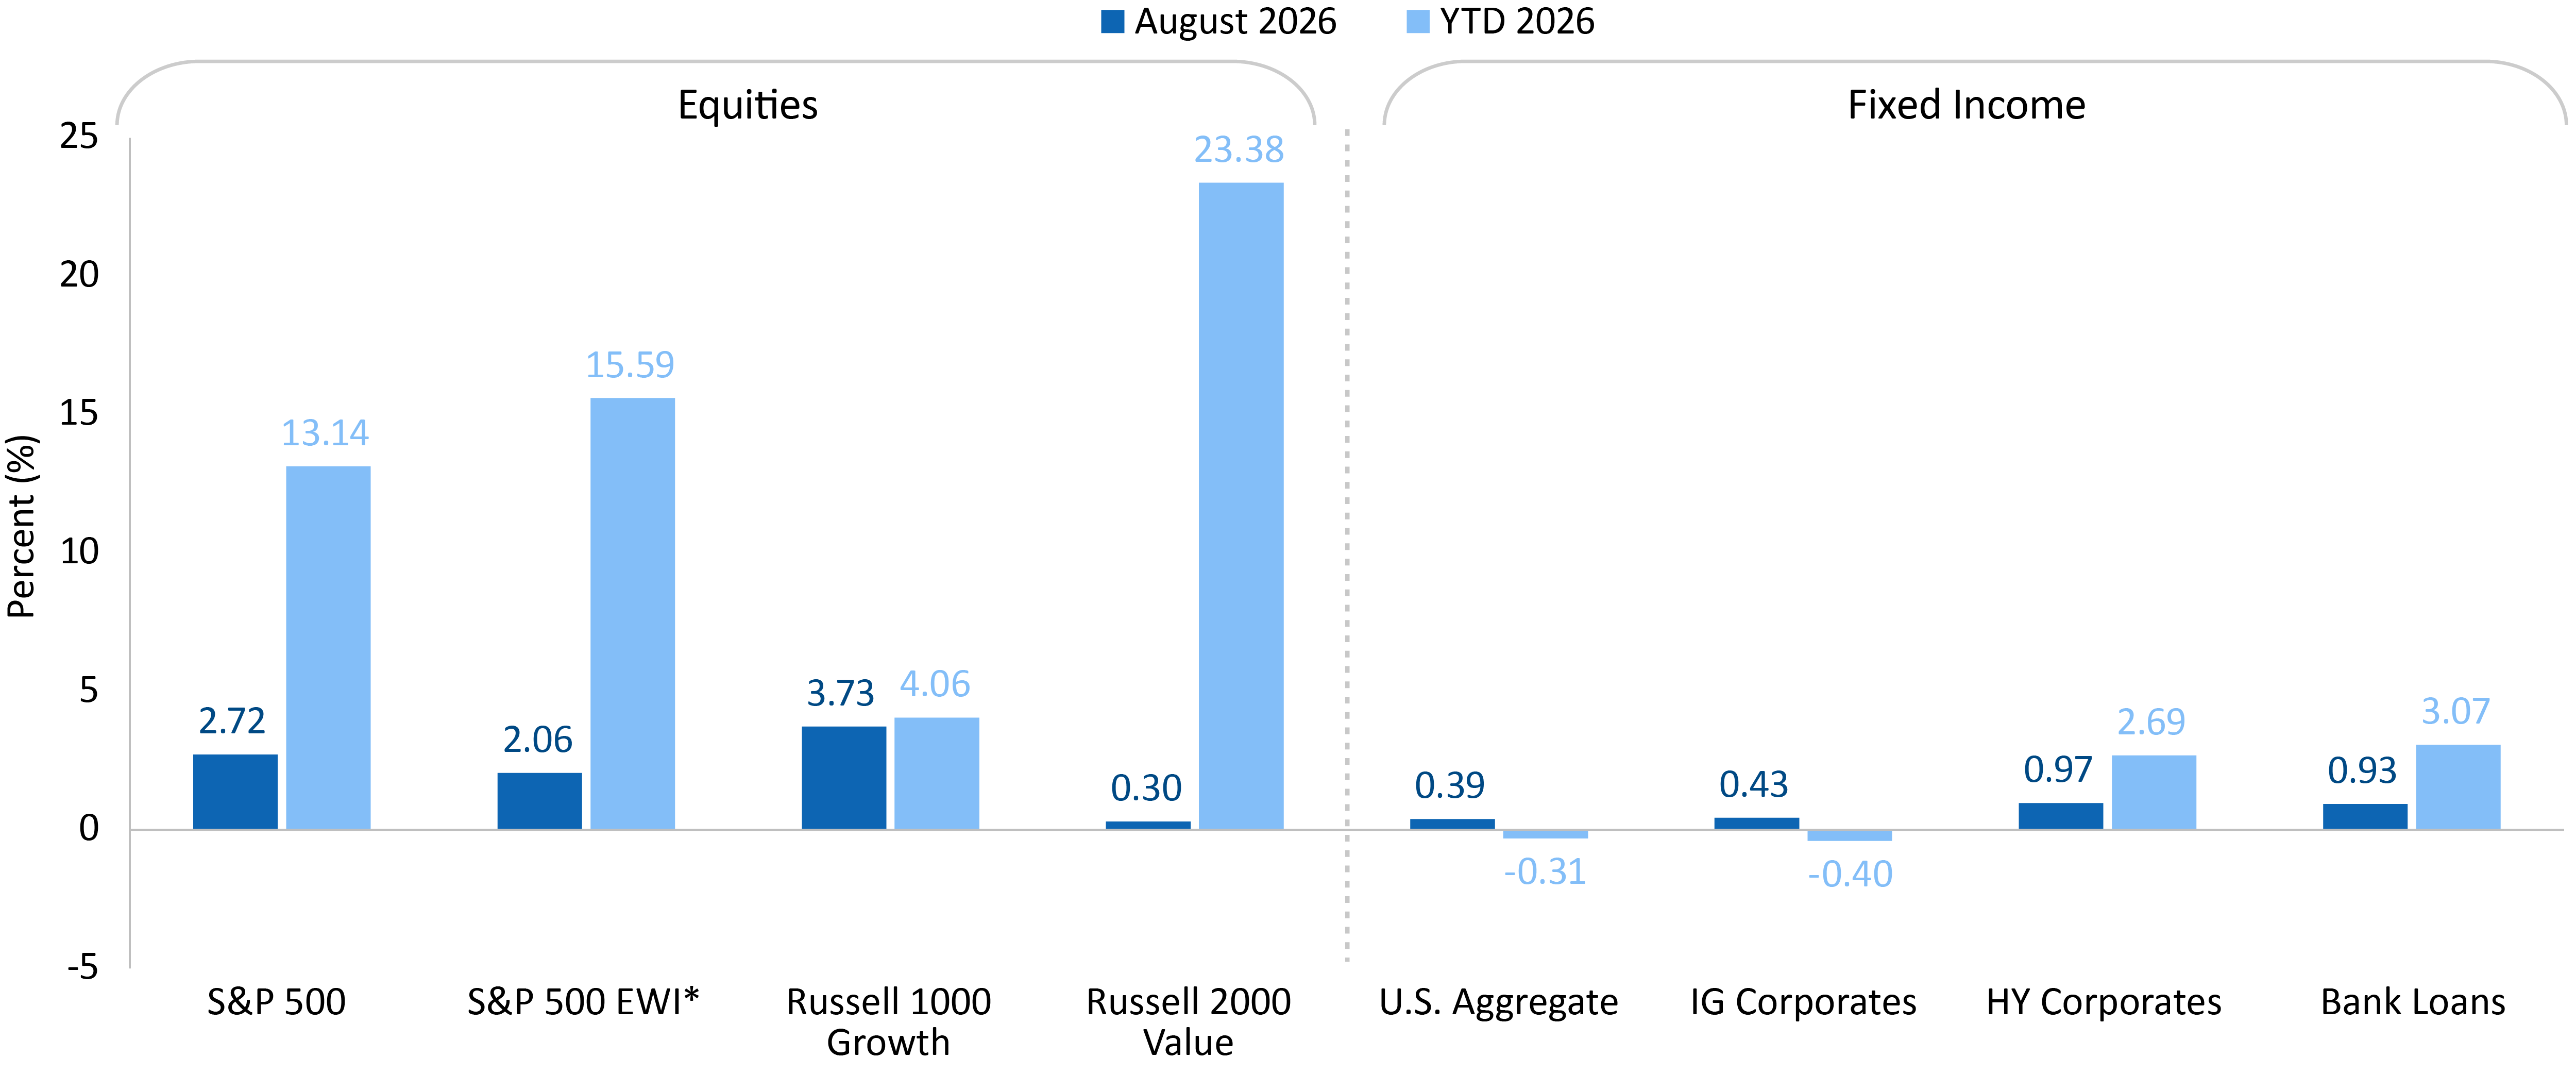
How did stocks and bonds perform in August?
I’ll start with bonds. Inflation and yields were stable last month, with the 10-year Treasury yield hovering around 4.7%. Thus, coupon payments drove bond returns. The Bloomberg U.S. Aggregate Bond Index returned 39 basis points (bps), and investment grade corporates returned 43 bps. Leveraged finance led fixed income performance, with high yield corporates and bank loans returning close to 1% in August, and loans returning more than 3% year to date.
Equities have generated impressive earnings, driving returns in August. The S&P 500 Index gained 2.7% last month, and the Russell 1000 Growth Index returned 3.7%. To be sure, equities have been volatile in September, but the earnings backdrop remains strong.
Mag 7 (& Co.)
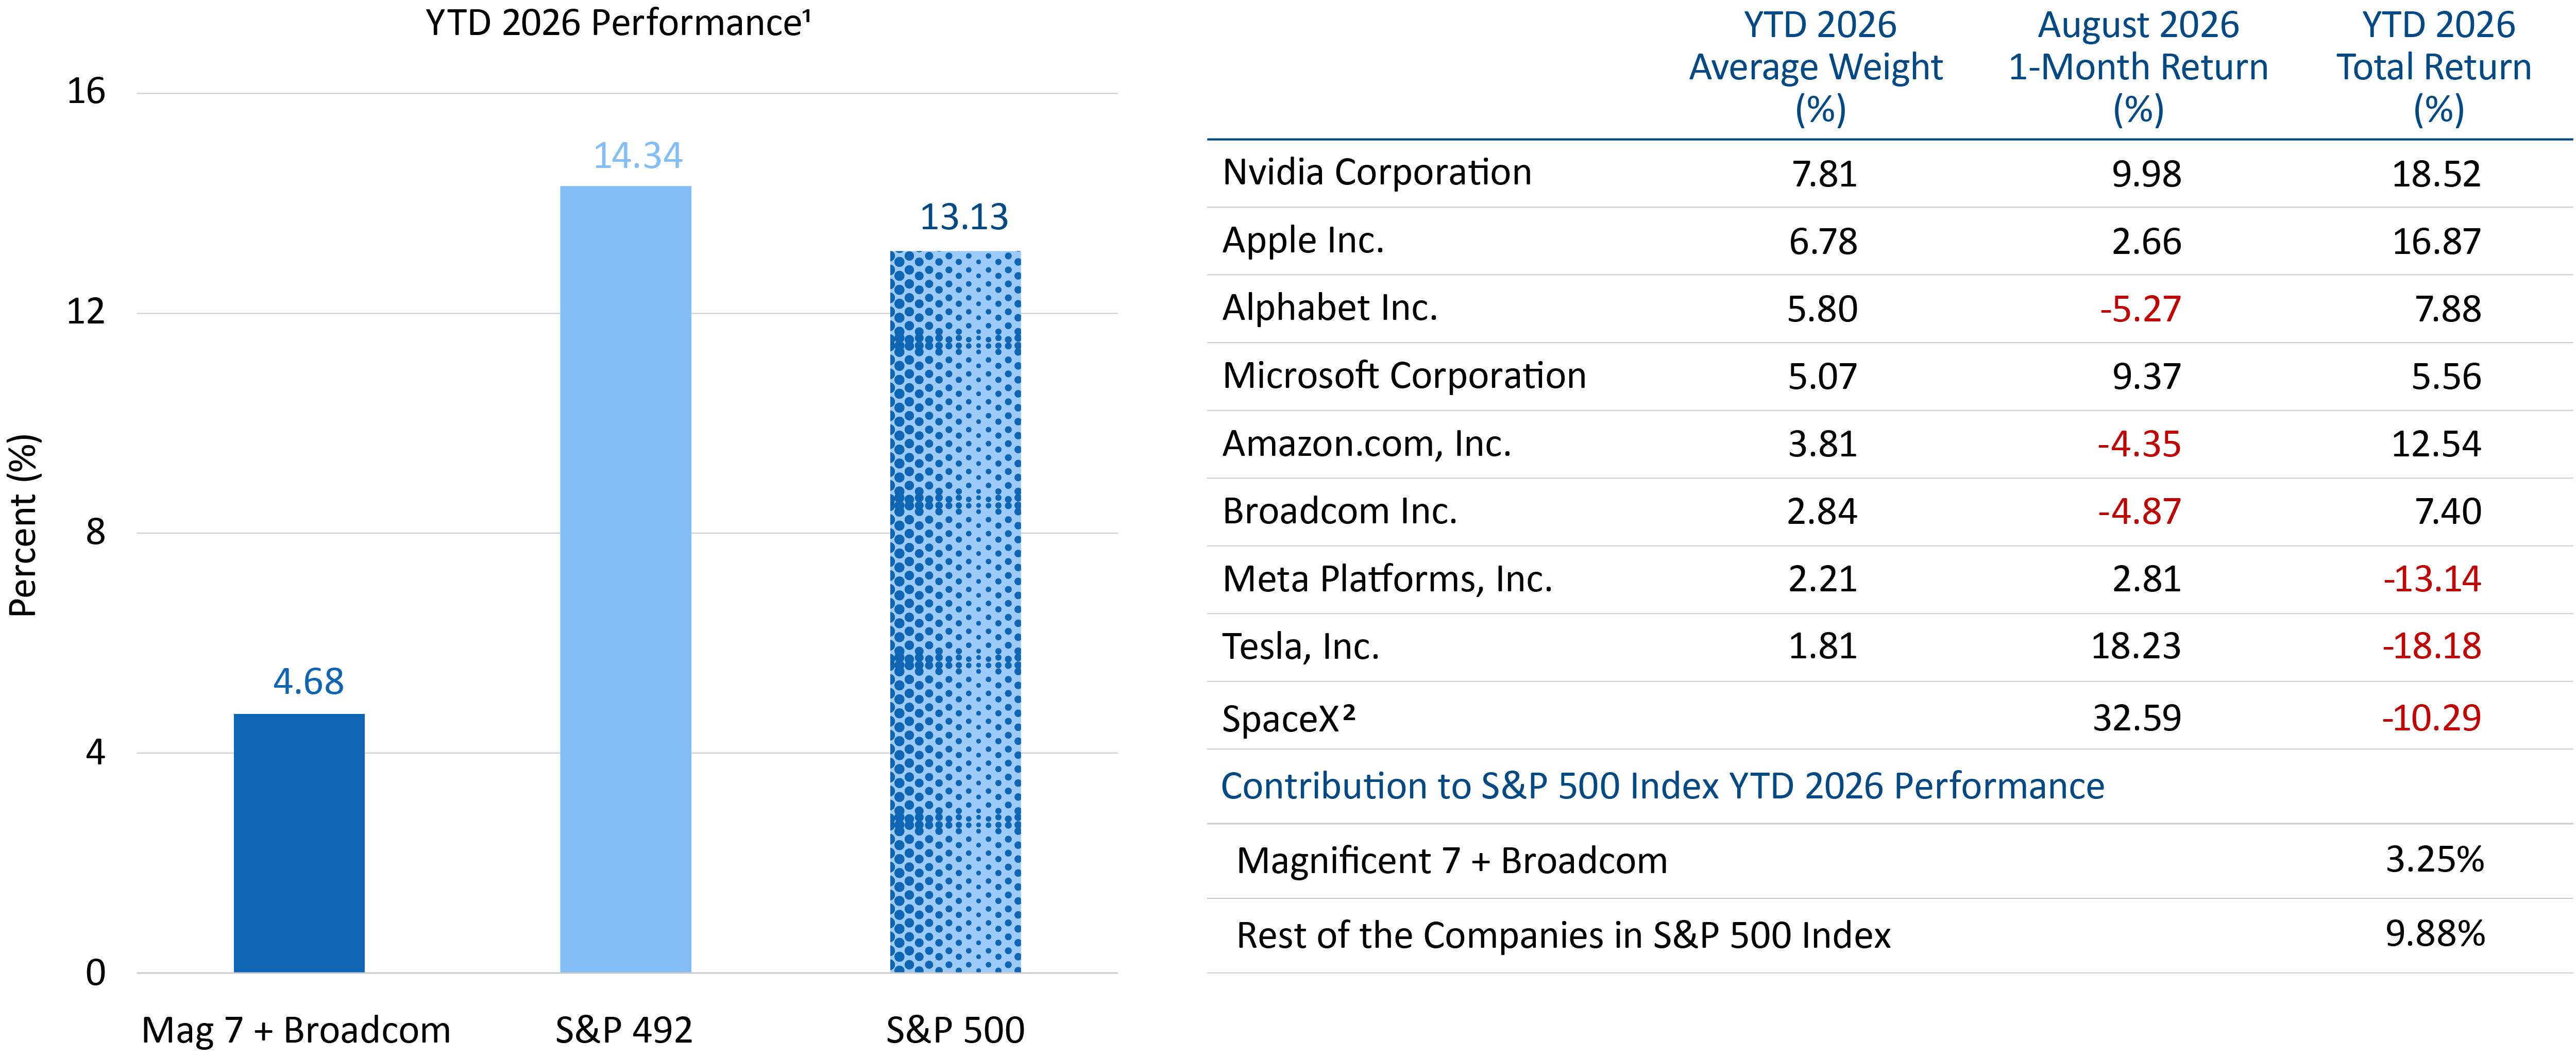
How did the Mag 7 (and company) perform?
They generally performed well, though Alphabet, Amazon and Broadcom’s stock were in the red in August. Nvidia’s stock returned nearly 10% last month, after reporting $96.2 billion in second-quarter revenue – beating analysts' expectations– and a 75% gross margin, and forecasting sales growth of 70% for the next fiscal year. Incredible numbers.
It’s interesting to follow SpaceX, even if the company is not yet in the S&P 500. SpaceX beat analysts' expectations on revenue and reported less profit loss for its AI business than expected. Its stock returned 32.6% in August on the news, regaining much of the ground it had lost in July.
The bigger story continues to be the broadening bull market. While the Mag 7 + Broadcom have returned 4.7% on average year to date, the other 492 companies in the S&P 500 have returned 14.3% on average.
Economic Dashboard
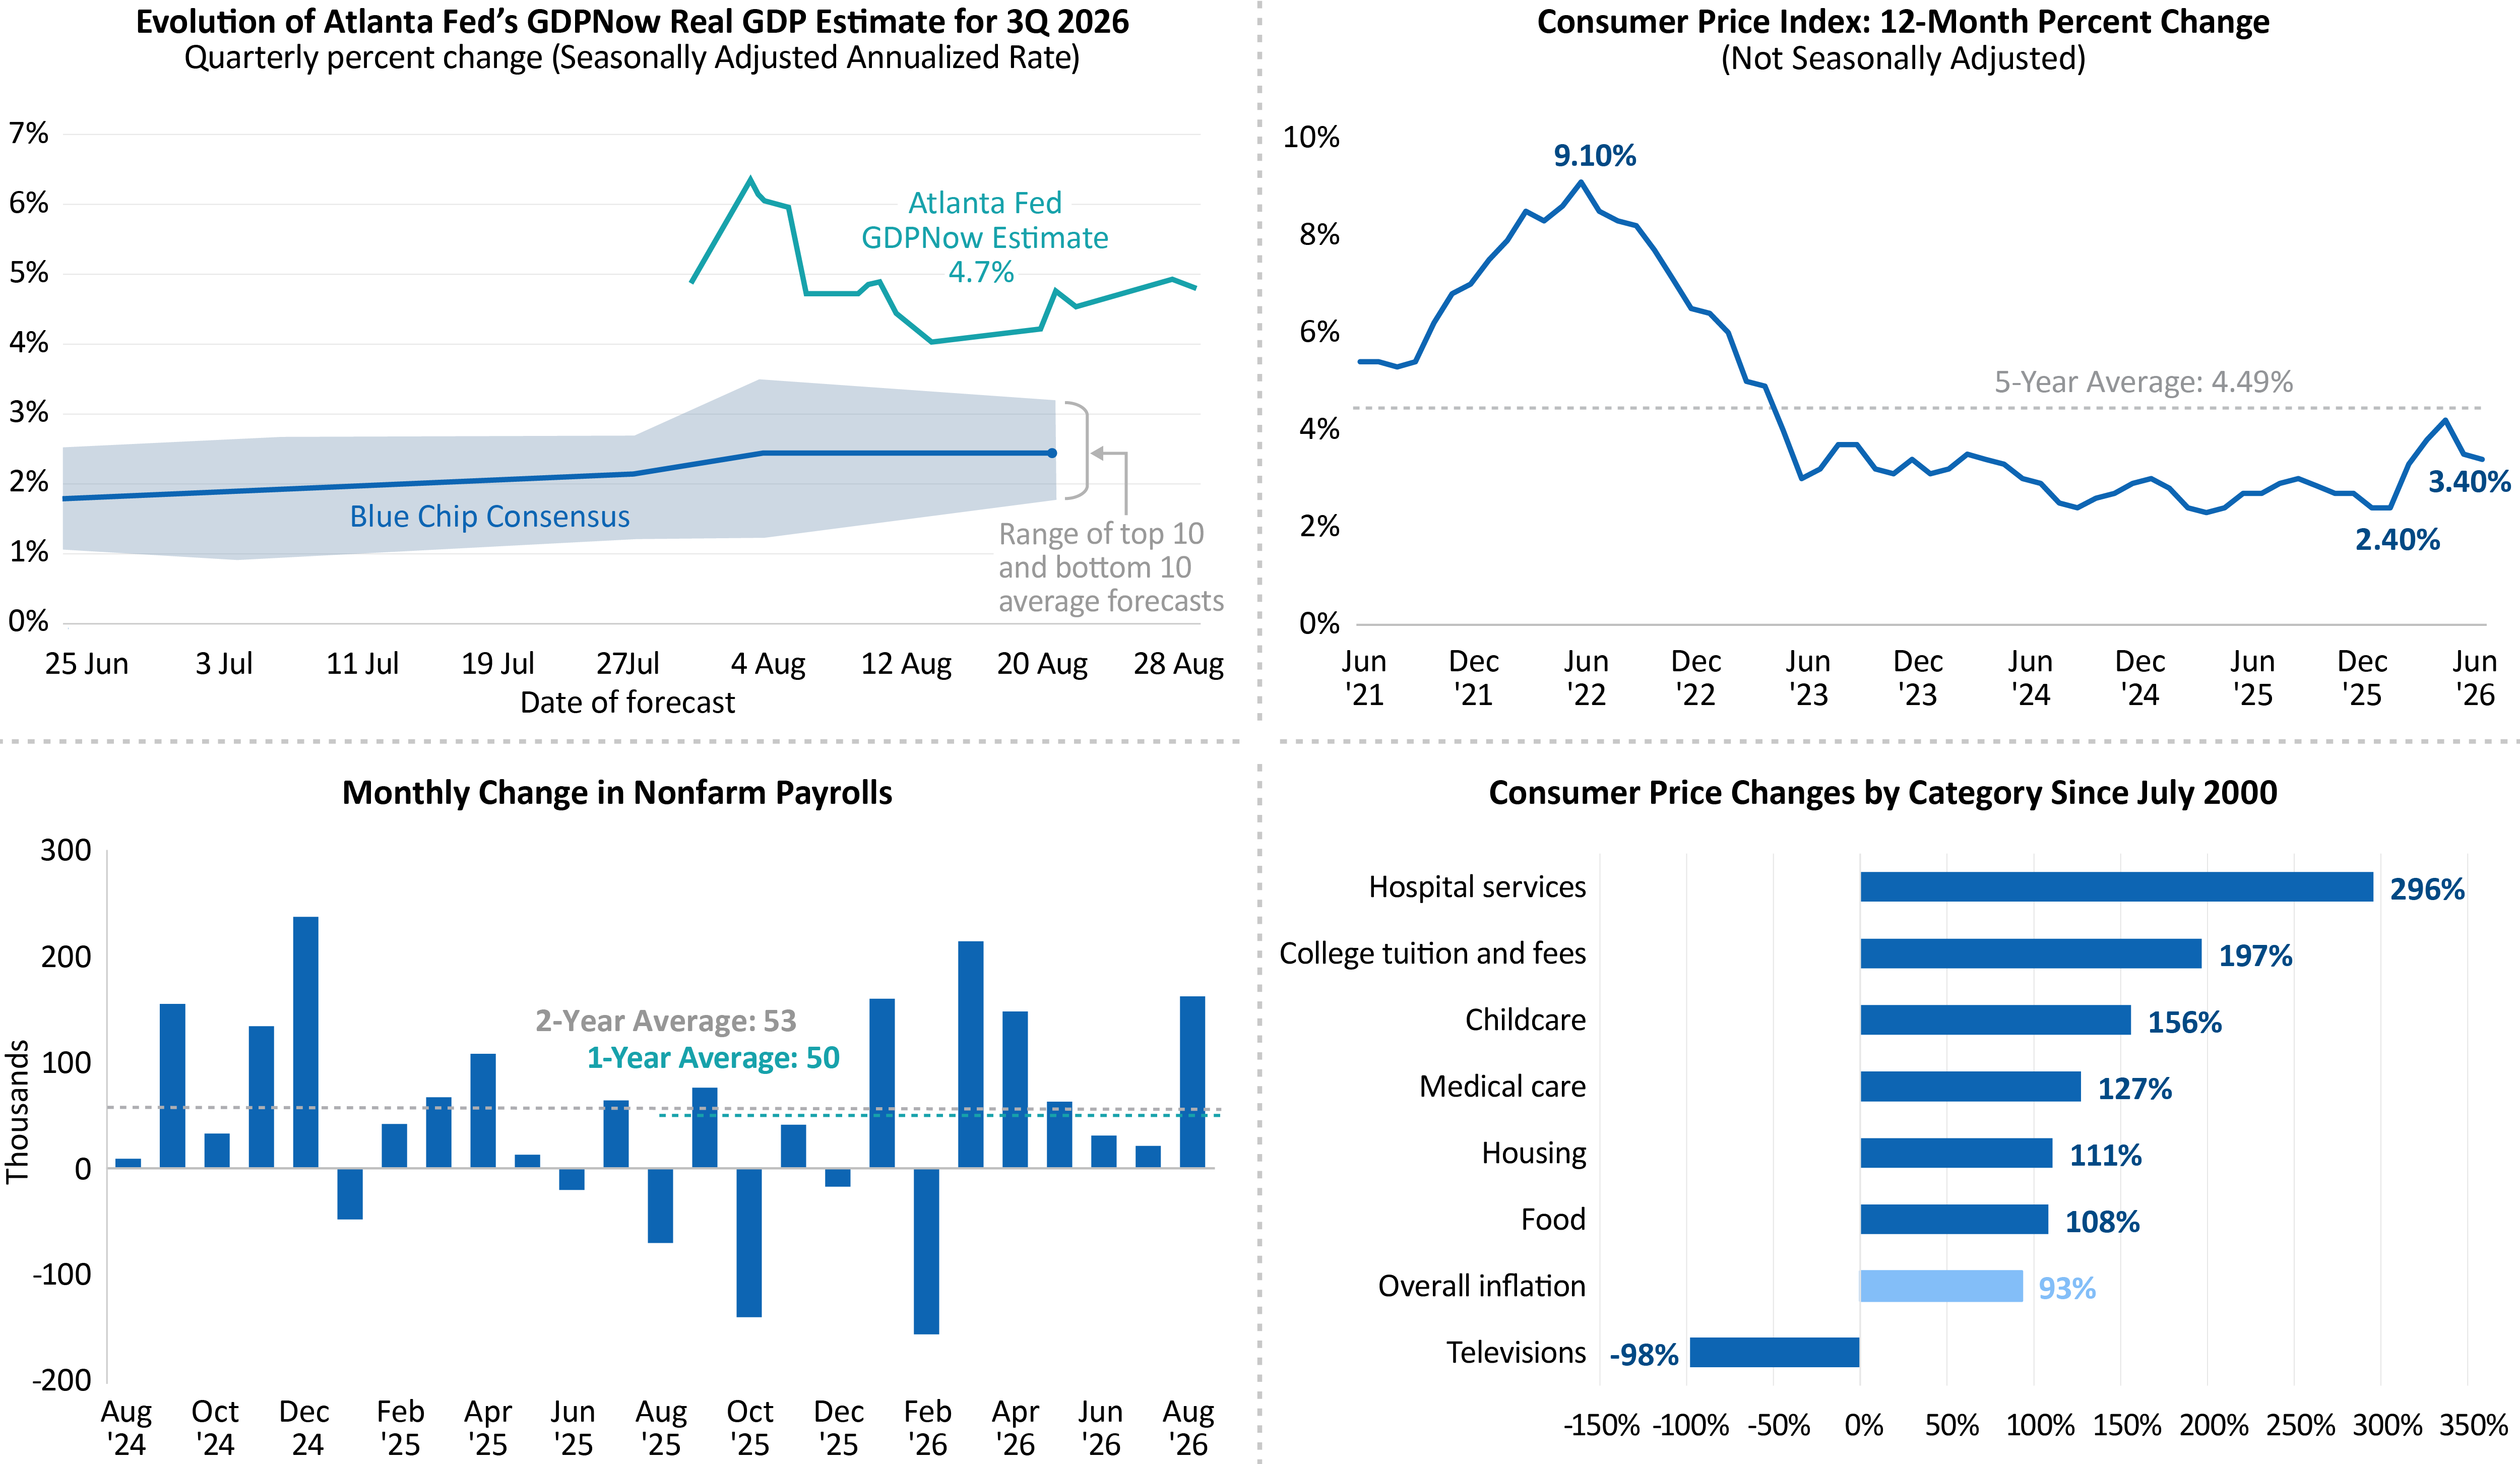
What's the current data telling us on the health of the U.S. economy?
The economy continues to expand. The Federal Reserve Bank of Atlanta’s real GDPNow indicator for third-quarter growth has consistently been above 4%. U.S. employers added 162,000 jobs in August, far surpassing expectations, while the unemployment rate held at 4.1%. The Consumer Price Index rose 3.4% in August, which was both what analysts expected and the same as July – also off the near-term peak of 3.5% in June.
However, as we have this conversation, oil prices have been hovering around $100 per barrel. So, the good news is the economy is doing well, and the bad news is the Federal Reserve has reason to raise short-term interest rates.
We reviewed inflation since July 2000 – we intend to discuss this more next time – and found that prices have increased dramatically since then on things people need or feel is important to themselves or their children. Hospital services prices increased the most, with costs rising nearly 300% since 2000. College tuition and fees came in second at nearly 200%. Childcare, other medical care, housing, and food prices have all increased more than 100%. While this is over 26 years, these increases are substantial and I believe they are contributing to the frustration of the voting public. I expect these rising costs will motivate many voters at the mid-term elections.
Global Yields Are on The Move
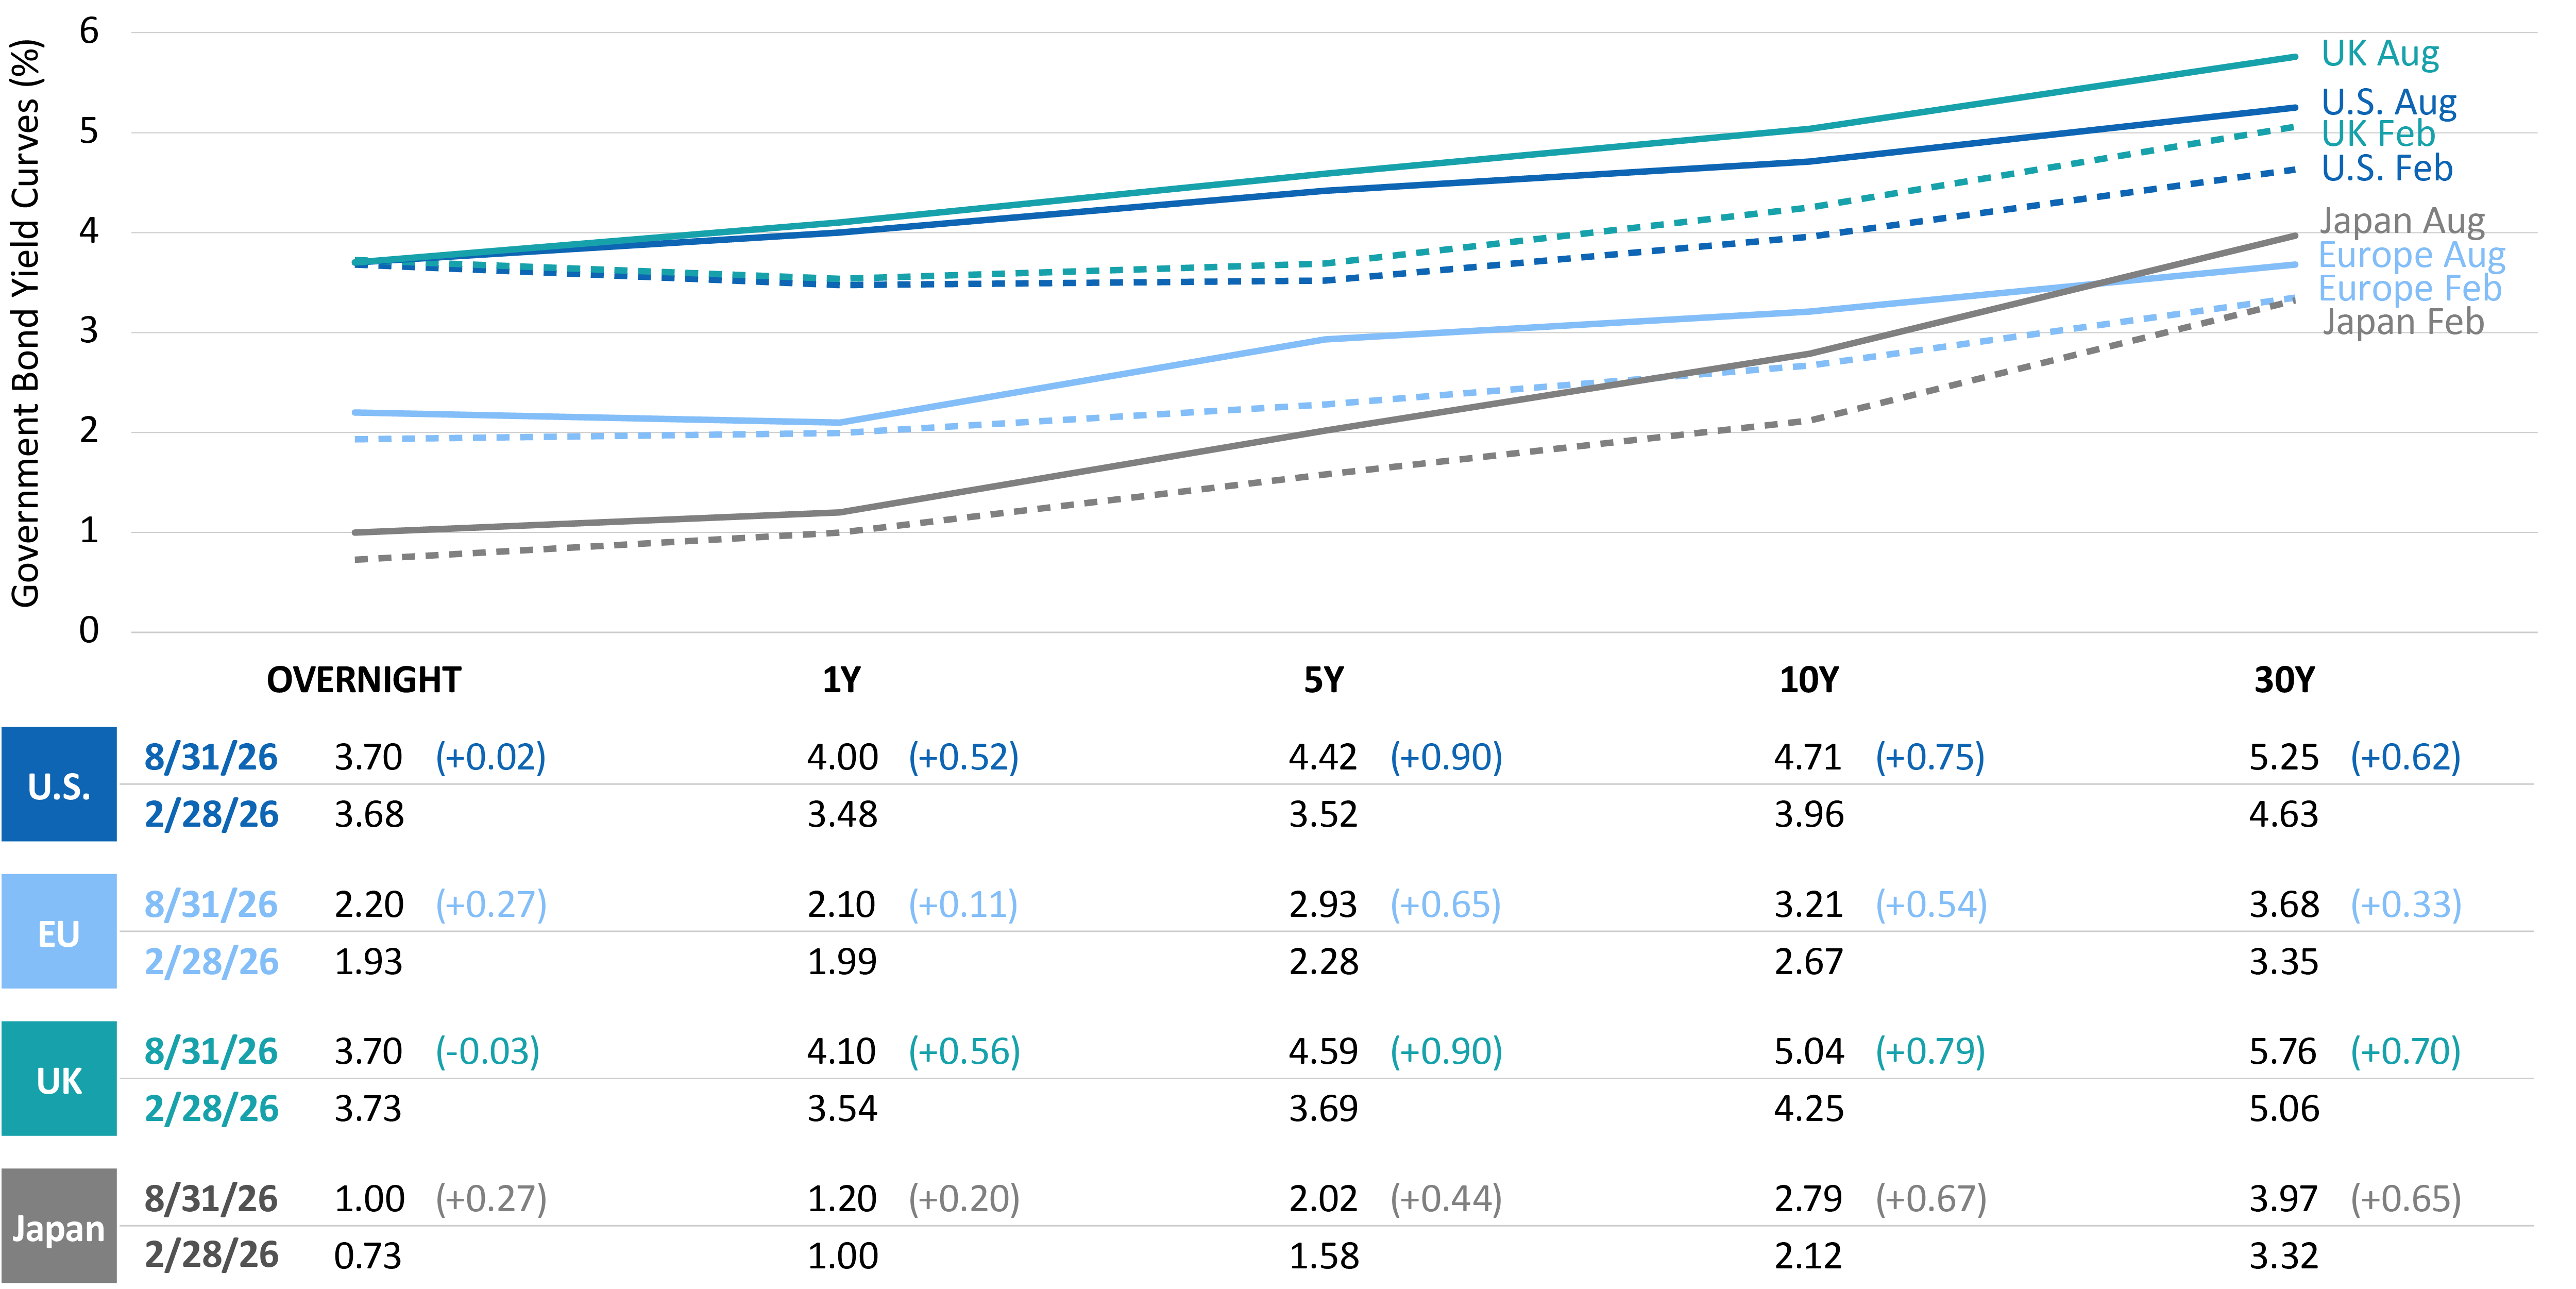
Let’s shift to our special topic: the rise in global bond yields and recent interventions in global markets. To begin with, how have yields changed in the last six months, and what has driven the change?
We crunched the numbers on bond yields of four major economies: the United States, Europe, the United Kingdom, and Japan. From February 28, when the U.S. began hostilities with Iran, to the end of August, overnight yields hardly moved in the U.S. and U.K. and only rose 27 bps in Europe and Japan. However, from one-year duration and up yields rose significantly, steepening the yield curve. The highest yields are on the long end, with the 30-year U.S. Treasury bond yielding 5.25% at the end of August, up 62 bps since February 28. I find it staggering that long-end yields are so high, especially since it came as a surprise to many financial professionals. The consensus among Wall Street in January was that the Fed would cut short-term rates and long-term rates would also decline.
I see three immediate drivers of rate increases this year: the rise in energy prices since the disruption of seaborne traffic through the Strait of Hormuz, the massive capital expenditure related to artificial intelligence, and the tariffs. Intermediate factors that are net inflationary, and thus put upward pressure on rates, include the reduction in immigration and the broader deglobalization trend. The picture shifts, however, as one looks out over a longer time horizon: trends in demographics, technological advancement, and wealth concentration should be disinflationary. For example, the AI build out is near-term inflationary, but over the long-term it should increase productivity and thus be disinflationary. Budget deficits in the U.S. and other countries is also a factor. The U.S. government, for example, is running a recessionary-level deficit in an expanding economy.
Inflation Pressures Build Across Global Markets
What are the distinguishing features of rising prices across countries?
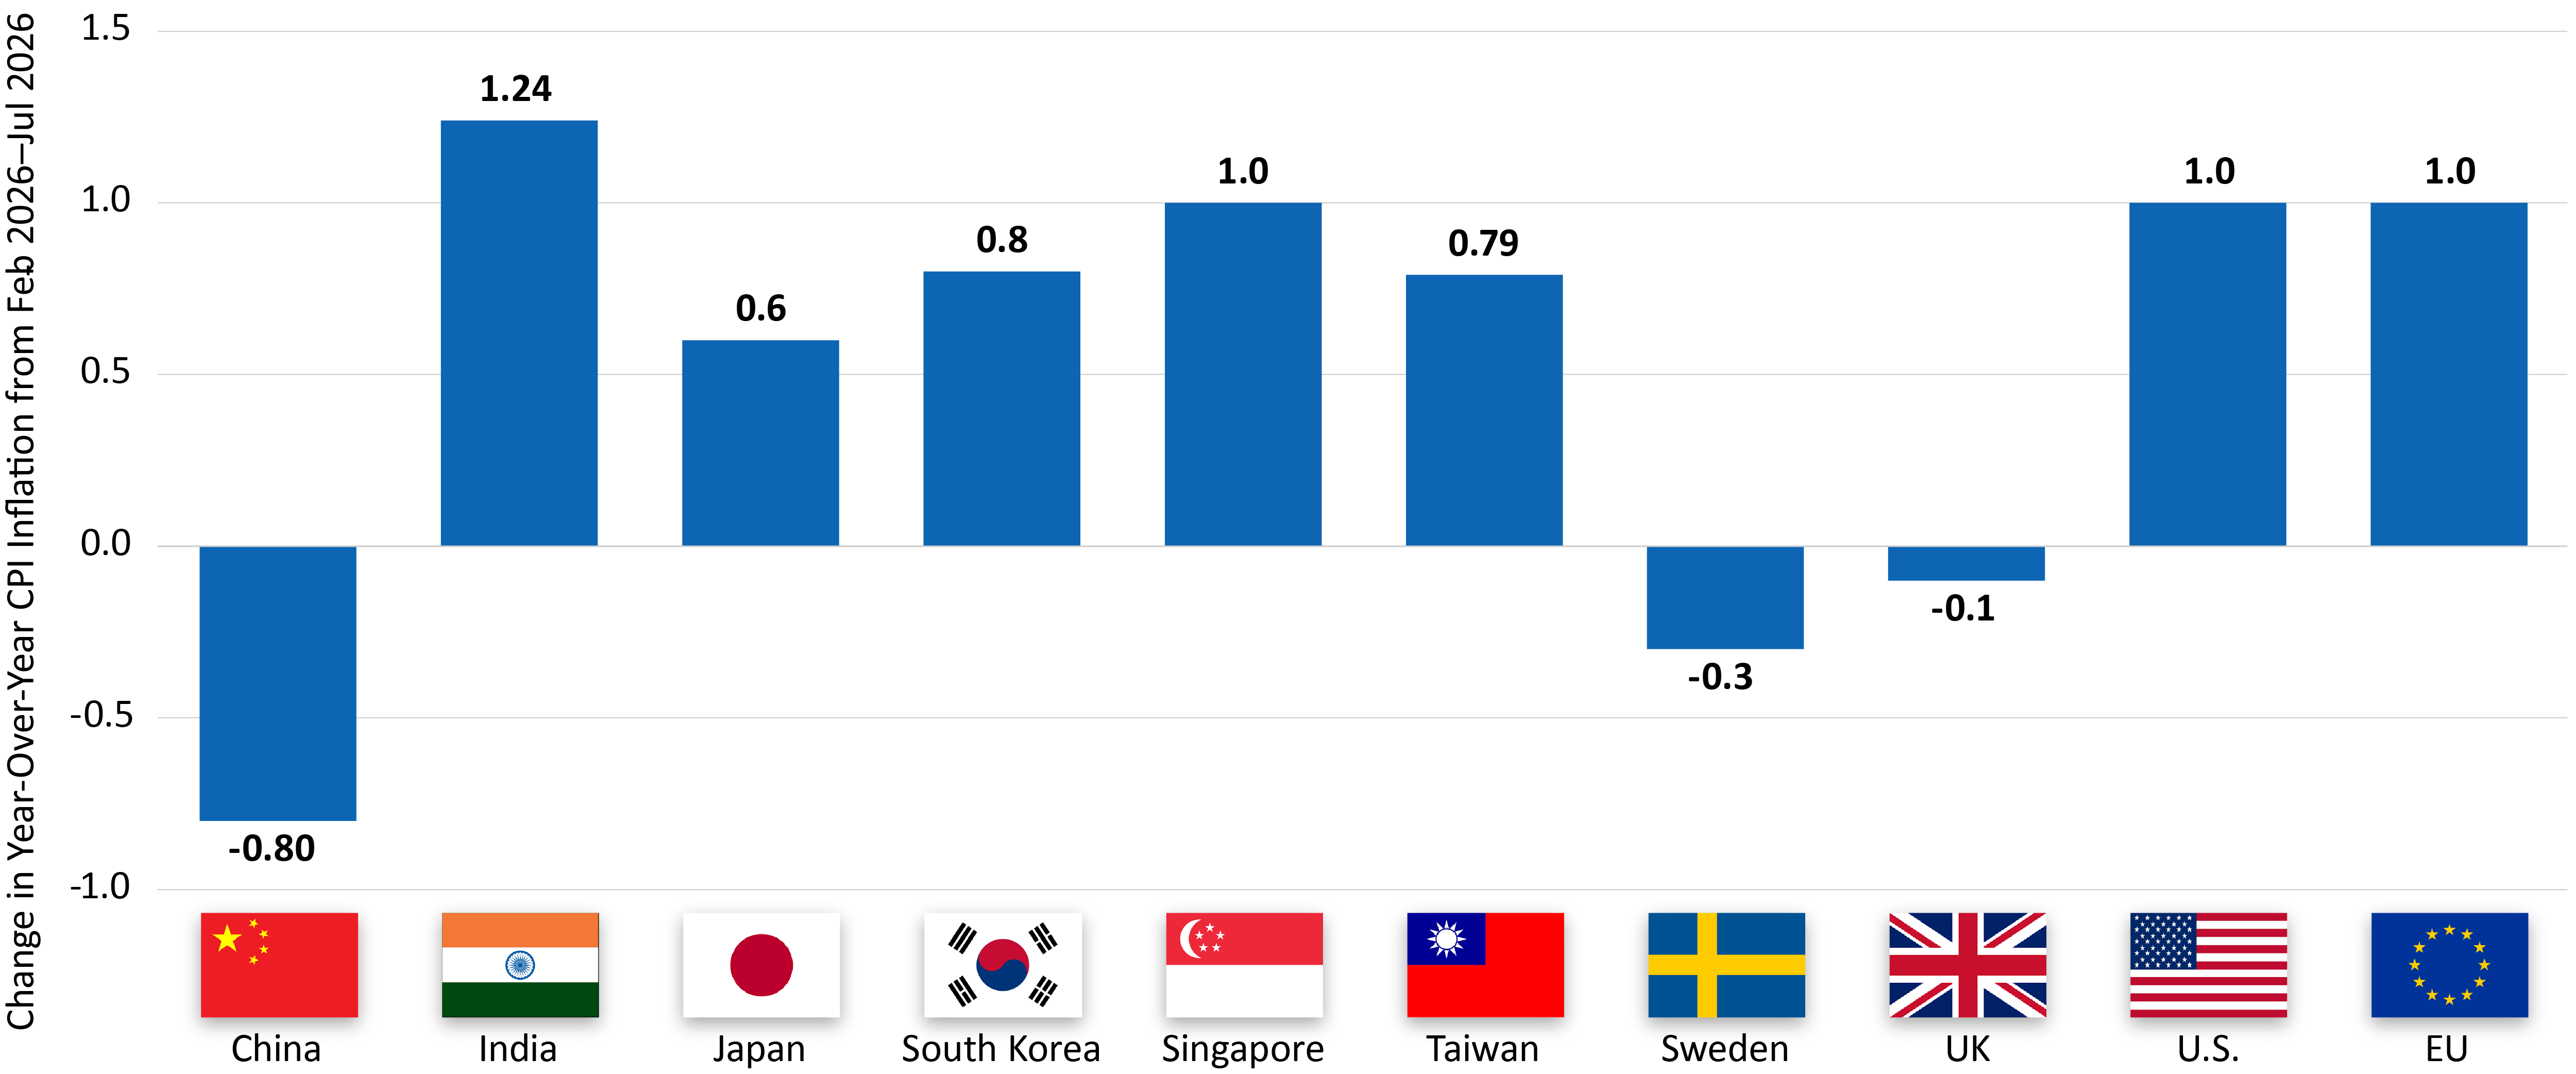
We expanded our analysis to include China, India, South Korea, Taiwan and Sweden, which we feel provides an informative spectrum of inflation trends. Since the Iran conflict began, CPI has risen one percentage point or more in the Euro area, India, Singapore and the U.S., and 60 bps or more in Japan, South Korea, and Taiwan. It’s a significant increase. Consider that in the U.S., the Fed is targeting 2% inflation, and our CPI rose from 2.4% in February to 3.4% in August.
China stands out with about an 80-bps decline in their CPI over the same period. They have been facing headwinds to aggregate demand, particularly due to the implosion of their real estate market, which has sapped consumer purchasing power. Sweden also has suffered from demand headwinds, and its CPI has declined about 30 bps.
Despite those exceptions, inflation is higher across many developed economies, and there is a correlation with the rise in global long-term yields.
Running Interference
What is the relationship between the U.S. and Japanese government bond markets?
It’s important to understand the carry trade. Japanese yields have been lower than U.S. yields for about three decades. Many investors have capitalized on the disparity by shorting yen and buying other assets, earning the spread between U.S. and Japanese rates. In addition, the yen has been losing value to the dollar for years, adding currency appreciation to the return earned by U.S. carry-trade investors. Under such attractive circumstances, some investors have used leverage to increase their positions, and the carry trade has ballooned to about $2 trillion.
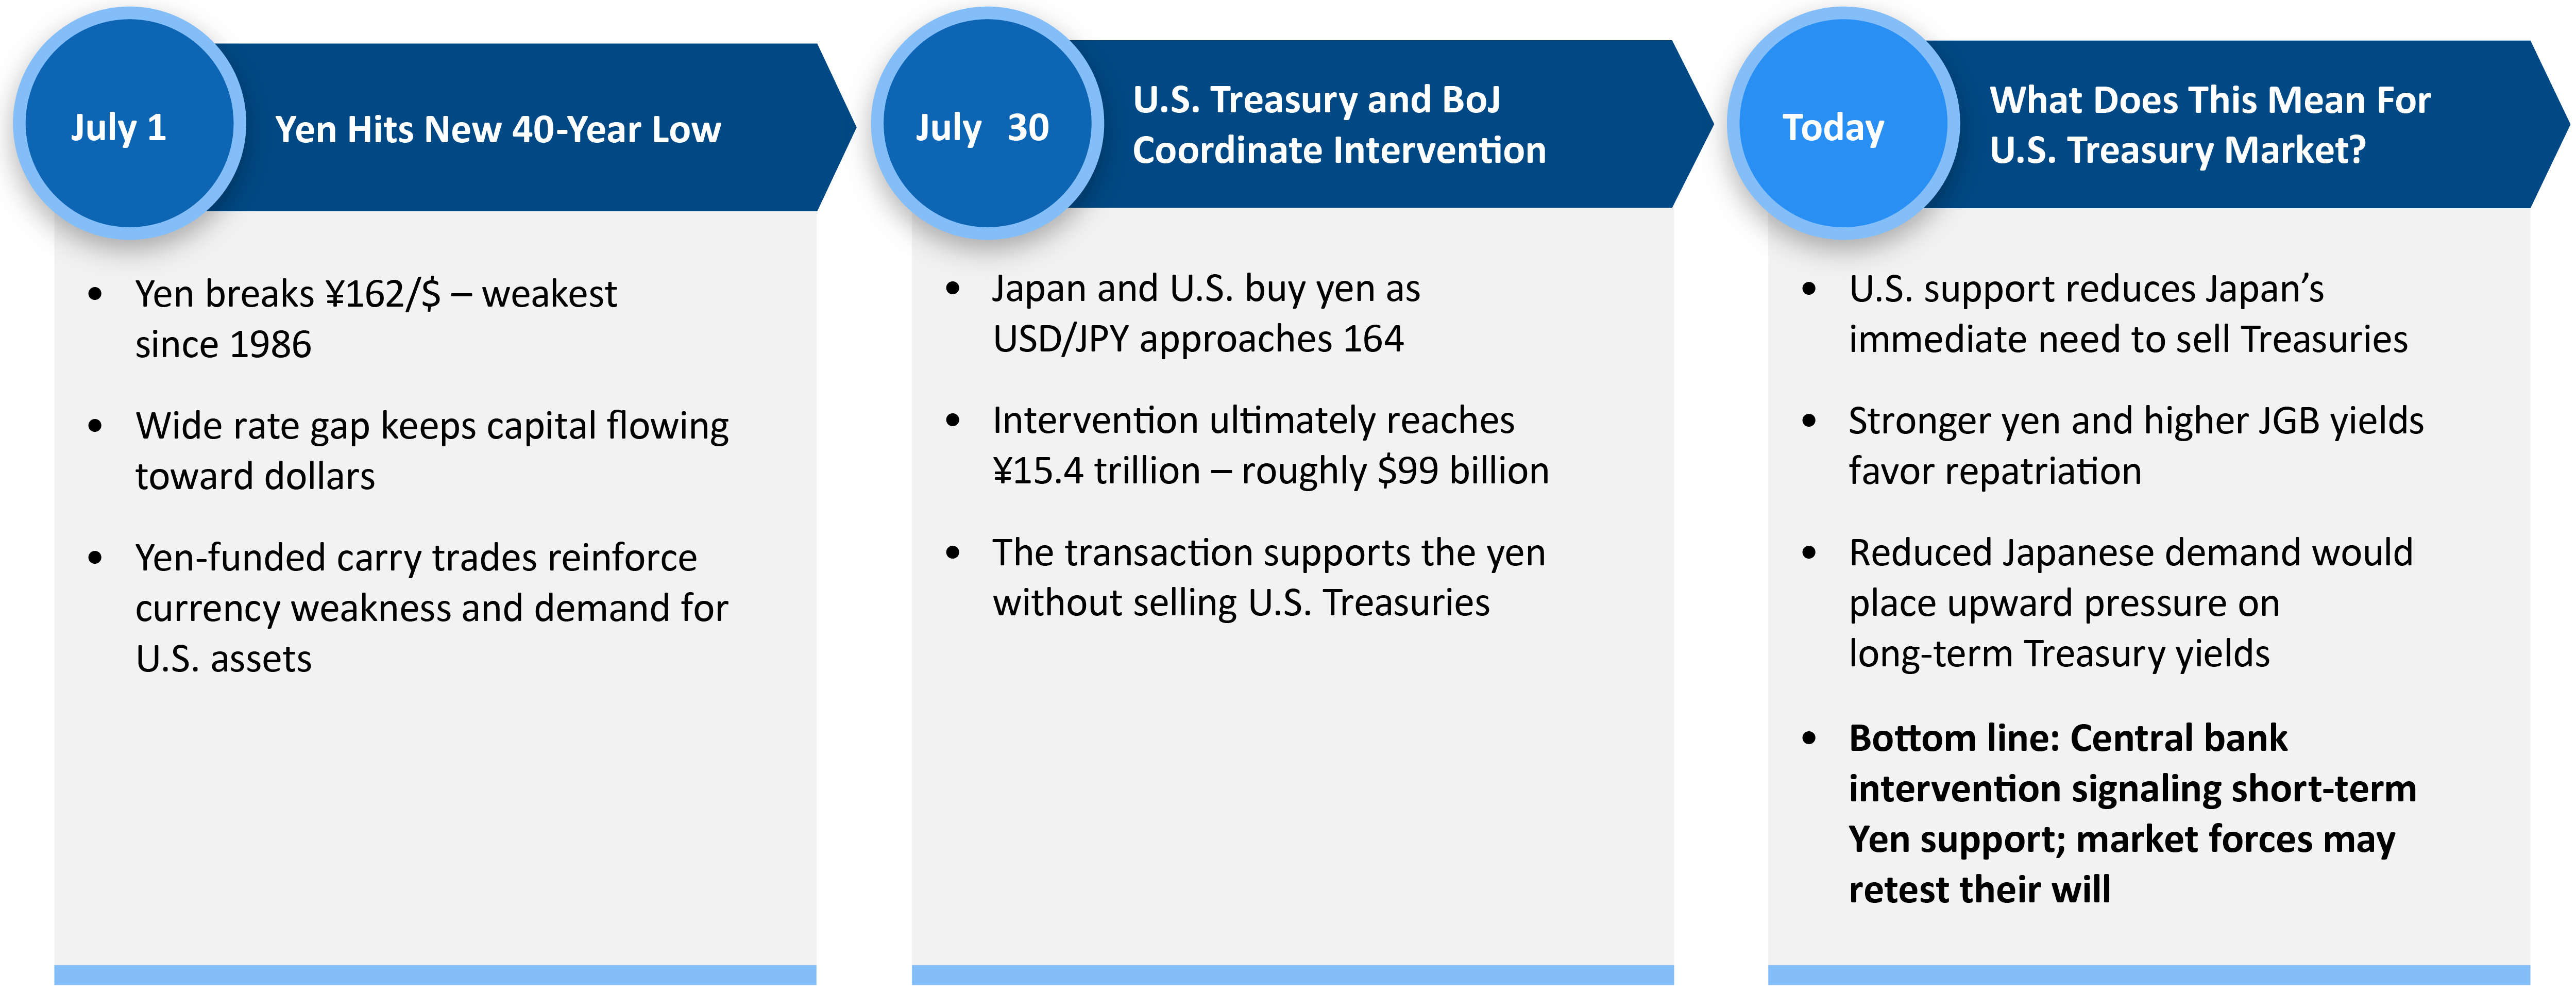
In 2024, one rate hike from the Bank of Japan surprised investors and prompted some leveraged investors to close out their positions. This year the BoJ is better telegraphing its intentions to raise rates, and the yen has been appreciating since late July, putting pressure once again on the carry trade.
More Recently, how have the two countries coordinated monetary policy?
The markets for both the yen and the dollar are massive and extremely efficient, and changes in their value can influence many risk assets. This summer the yen was declining and at first flirting with 162 yen to the dollar, and then in July it broke past that level, and Japan considered selling off some of its vast Treasury holdings to support its currency and lower inflation risk. However, the U.S., led by Treasury Secretary Scott Bessent, offered to coordinate yen purchases. Japan reportedly has spent close to $100 billion on yen purchases since the July nadir in its currency, and about $170 billion so far this year. The U.S. administration has not disclosed how much it spent, but in a colorful bit of reporting, the Wall Street Journal shared a photo of a to-do list written by Bessent, indicating a plan to purchase $5 billion to $10 billion of yen.
I think both governments are trying to signal to the marketplace that investors should unwind the massive leverage on the yen carry trade. Bessent recently reinforced the message, challenging traders to test his resolve, stating “I am the house now.”
Buyers and Sellers
How has the composition of the U.S. Treasury buyers changed in recent years?
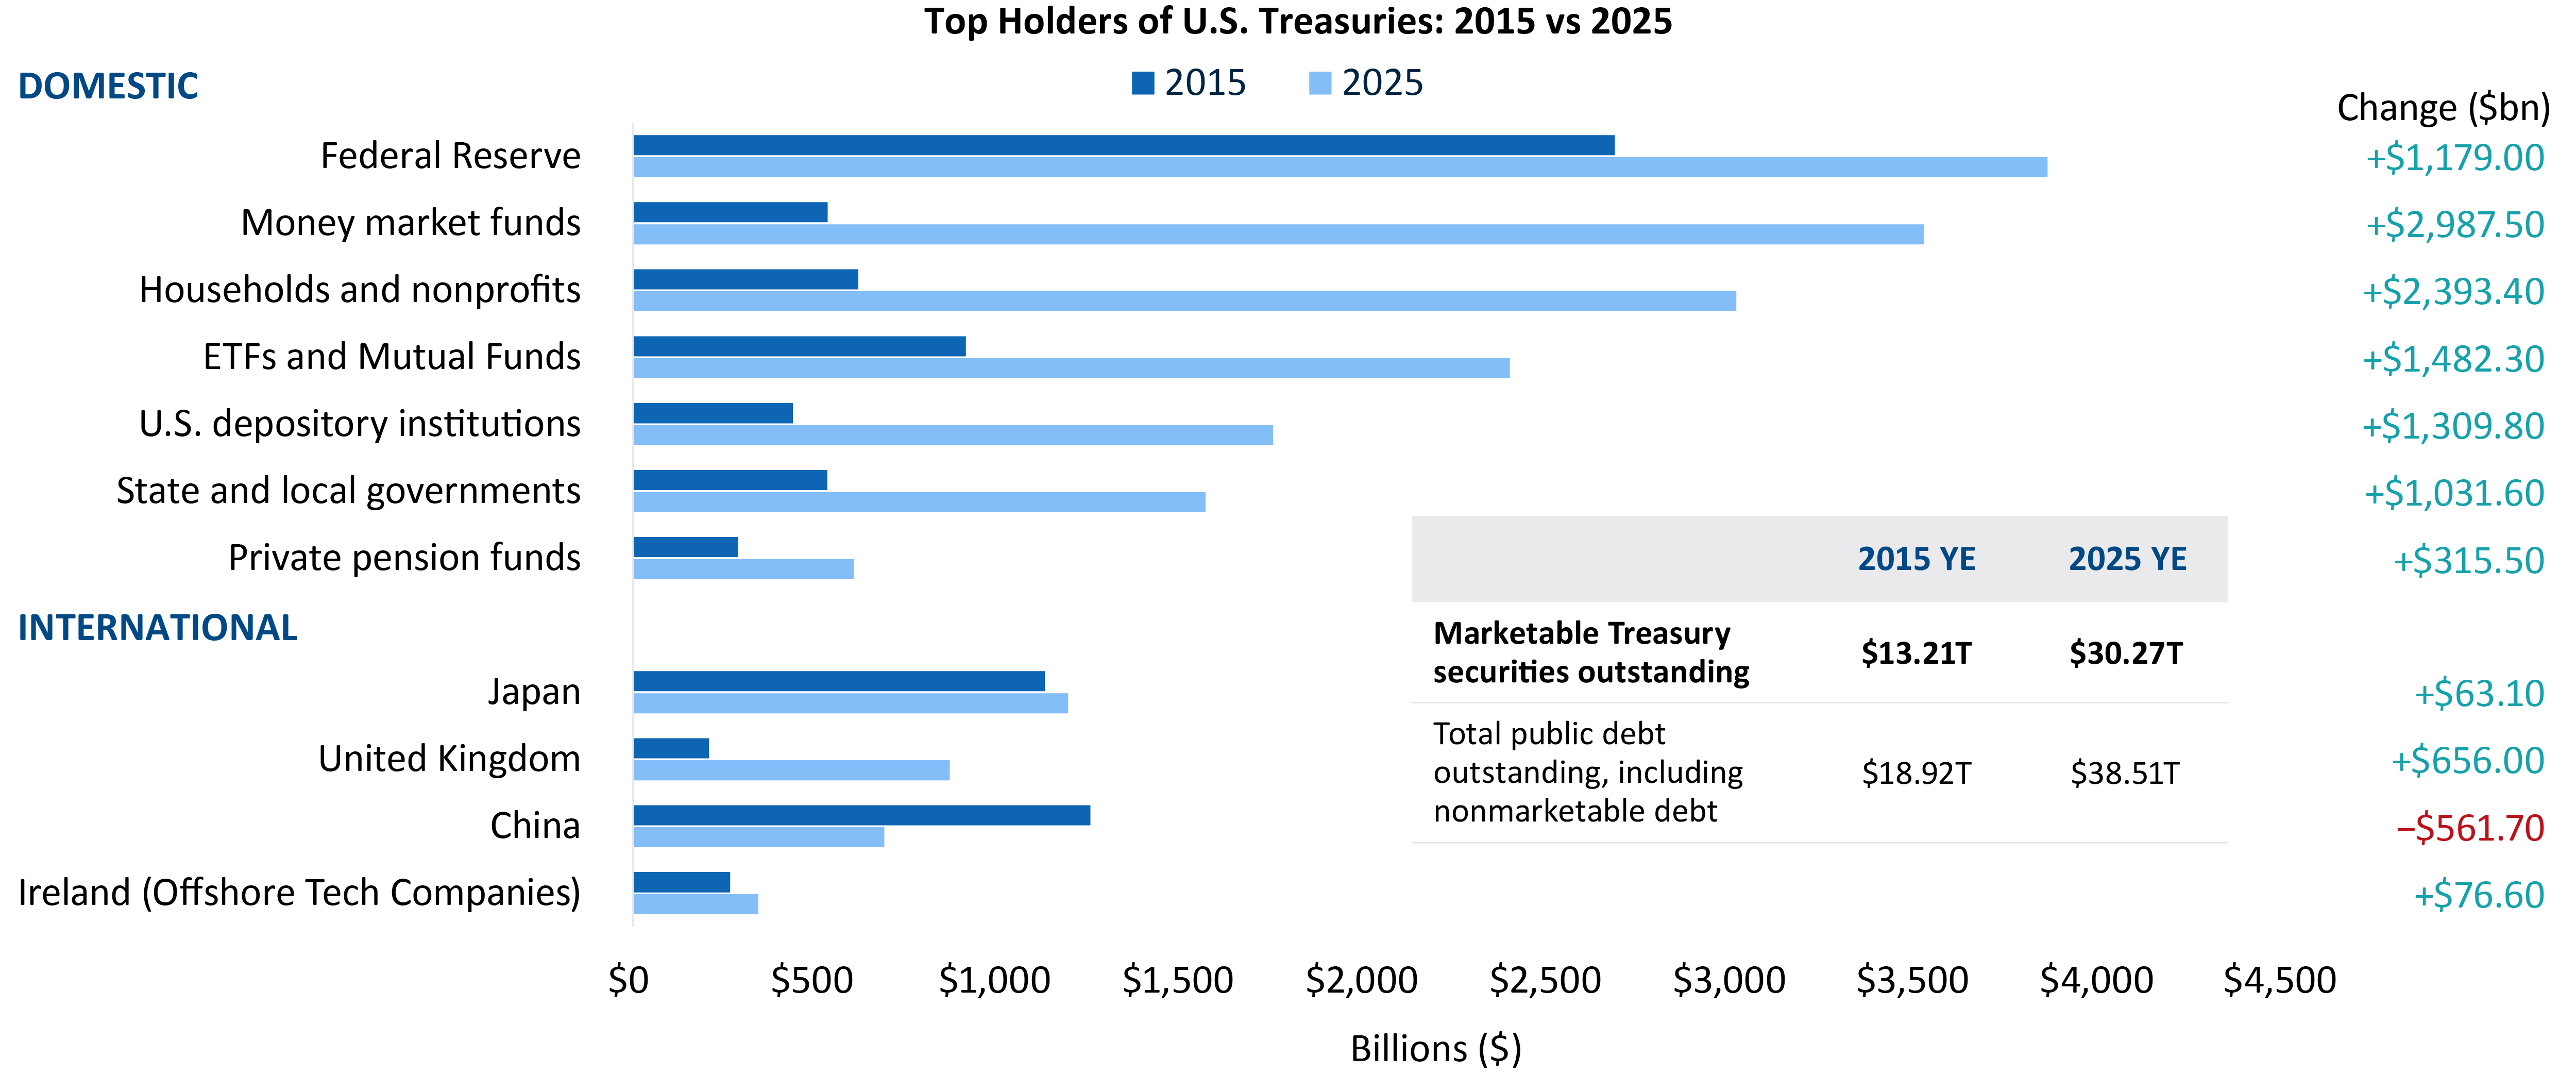
While the major holders of Treasuries were essentially the same entities in 2025 as in 2015, there has been a substantial shift in the amount and market share of their holdings over that time. For example, China and Japan took turns in 2015 as the United States’ largest foreign creditor, each holding more than $1 trillion in U.S. Treasuries, and I recall concerns back then over potential ramifications if China were to sell a large share of its holdings. In fact, China’s U.S. Treasury portfolio declined by $561 billion U.S. dollars over the past decade, and the sky has not fallen. Japan today is our largest foreign creditor, although its Treasury holdings are up just $63 billion over the period. The UK now is the second largest foreign creditor, having increased its holdings by $656 billion.
Meanwhile, public and private entities in the U.S. hold the lion's share of U.S. Treasuries, and the main categories of holders have all grown their portfolios significantly over the same 10-year period, far outpacing the increase by foreign creditors. The U.S. Federal Reserve remains the largest holder, and its portfolio of Treasuries has increased by more than $1 trillion. Interestingly, U.S. money market funds have increased Treasury holdings by nearly $3 trillion, and now are the second-largest holder of Treasuries. Households and nonprofits together account for a nearly $2.4 trillion increase, and ETFs and mutual funds have added close to $1.5 trillion. Banks, state and local governments, and private pension funds round out the list of top domestic holders, and all have increased their holdings.
This shift in market share to private buyers makes sense when one considers the increase in yields in recent years. When the 10-year Treasury yielded 1.5% to 2%, there was little economic reason to own it, and the domestic buyers tended to be the ones with noneconomic motivation, such as banks needing to meet regulatory requirements. Fast forward to higher yields in recent years, and it makes more economic sense for money market funds and other private actors to buy lots of Treasuries. We are essentially eating our own cooking.
Concluding Thoughts
What are the long-term effects of Treasury and central bank intervention?
For the U.S., the Treasury lately has played a larger role than the Federal Reserve. It’s unclear whether that trend continues beyond this presidential administration, and what the ramifications will be long term. In addition, Kevin Warsh is still early in his tenure as chair of the Fed, and we will have to wait and see what develops under his tenure.
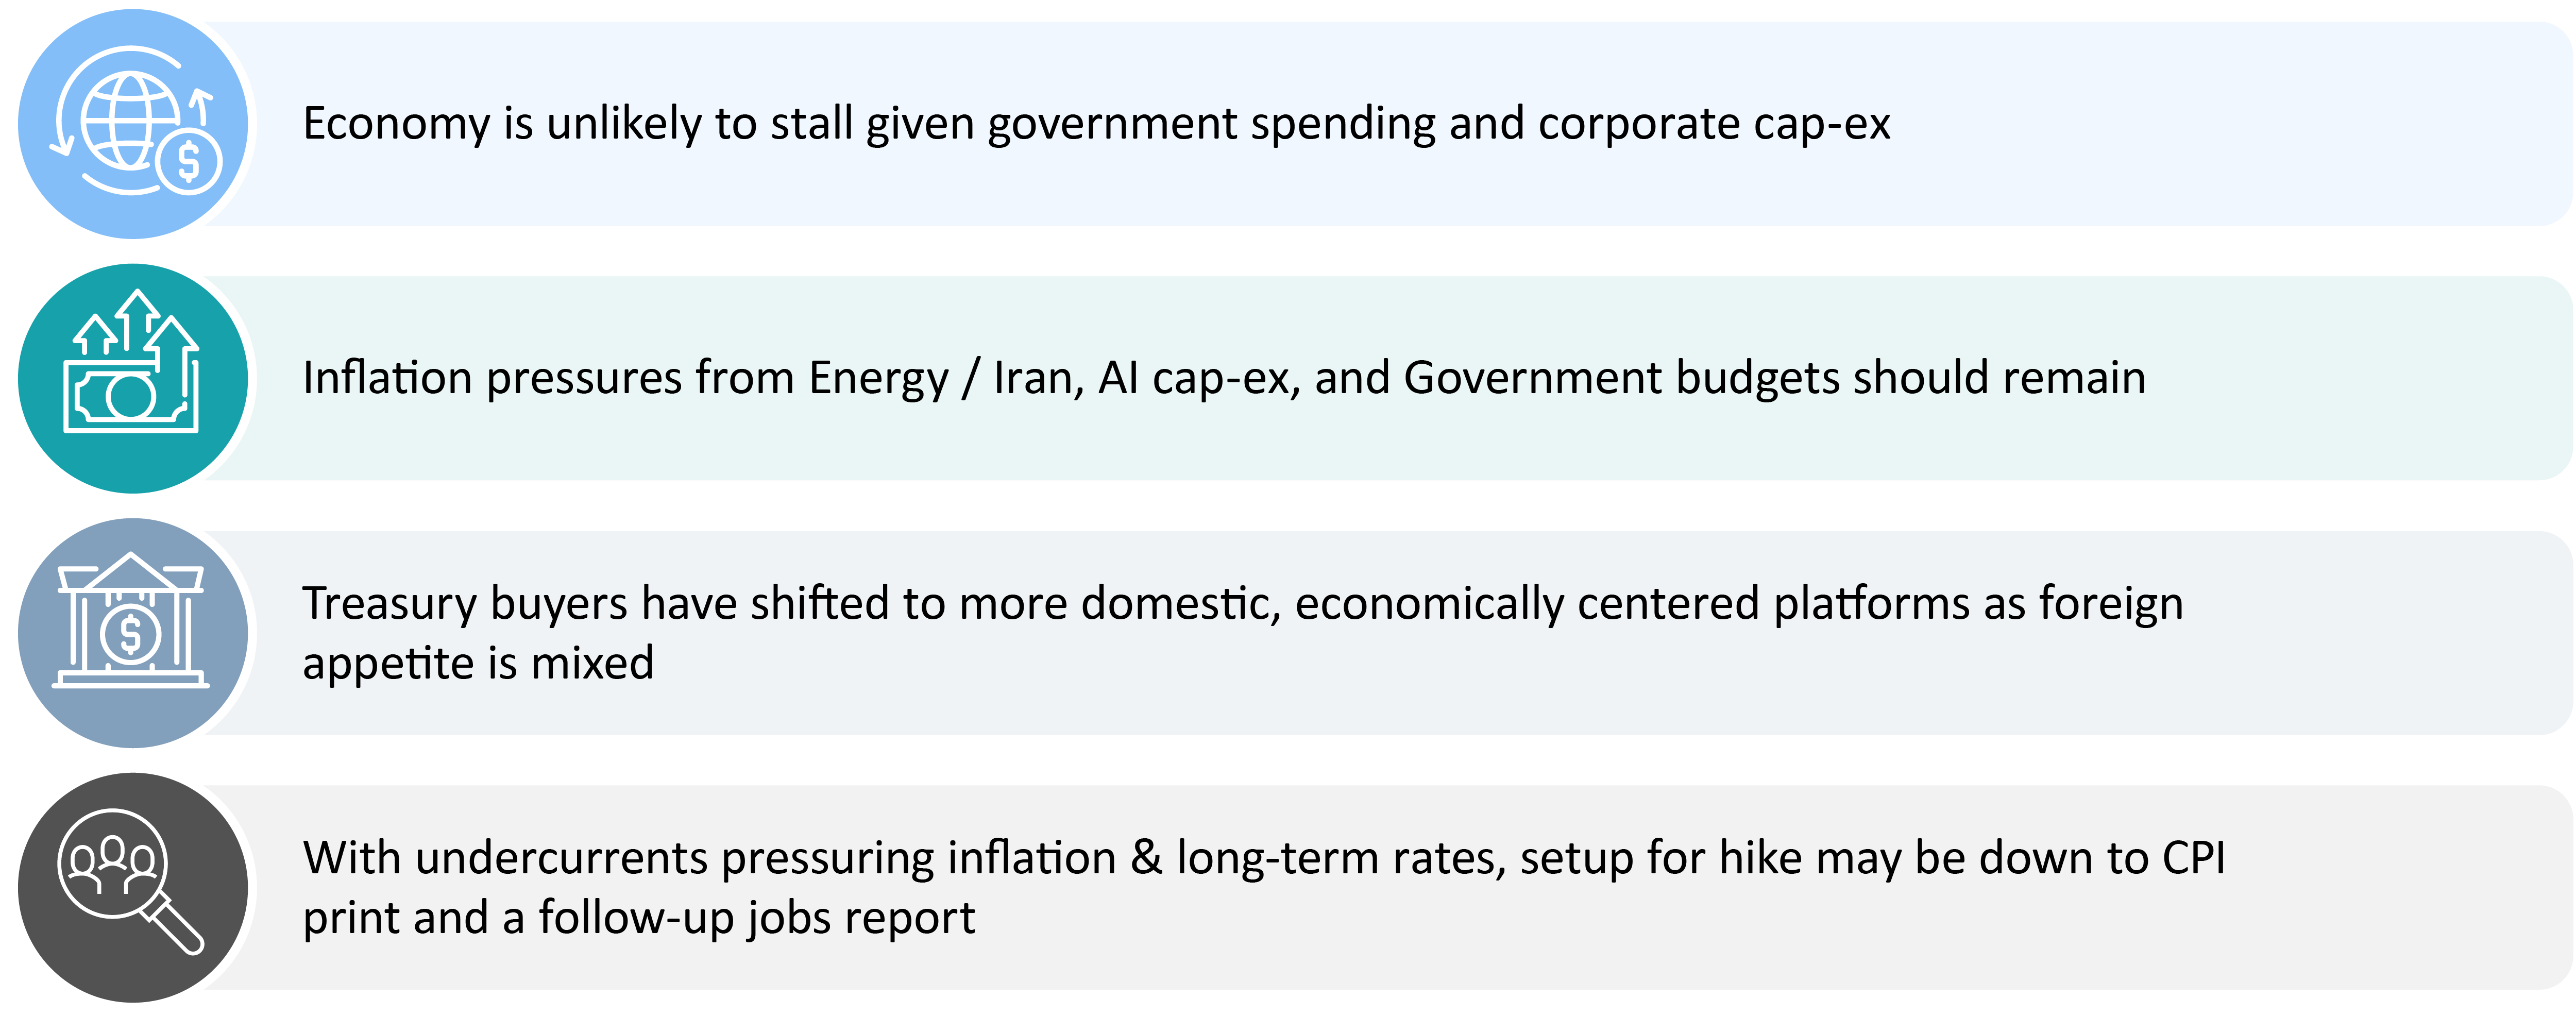
However, I do expect a few things relevant to many investors. First, the economy is unlikely to stall given both the deficit-fueled government spending and the robust corporate capital expenditure. Second, inflationary pressures from energy, artificial intelligence, and government budget deficits should continue. Third, as discussed, domestic buyers of Treasuries have increased their holdings dramatically, particularly private buyers attracted to higher yields. Those three trends are pressuring inflation and long-term rates, in my view, and giving the Fed reason to tighten.
Fixed Income Yields and Year-to-Date Returns
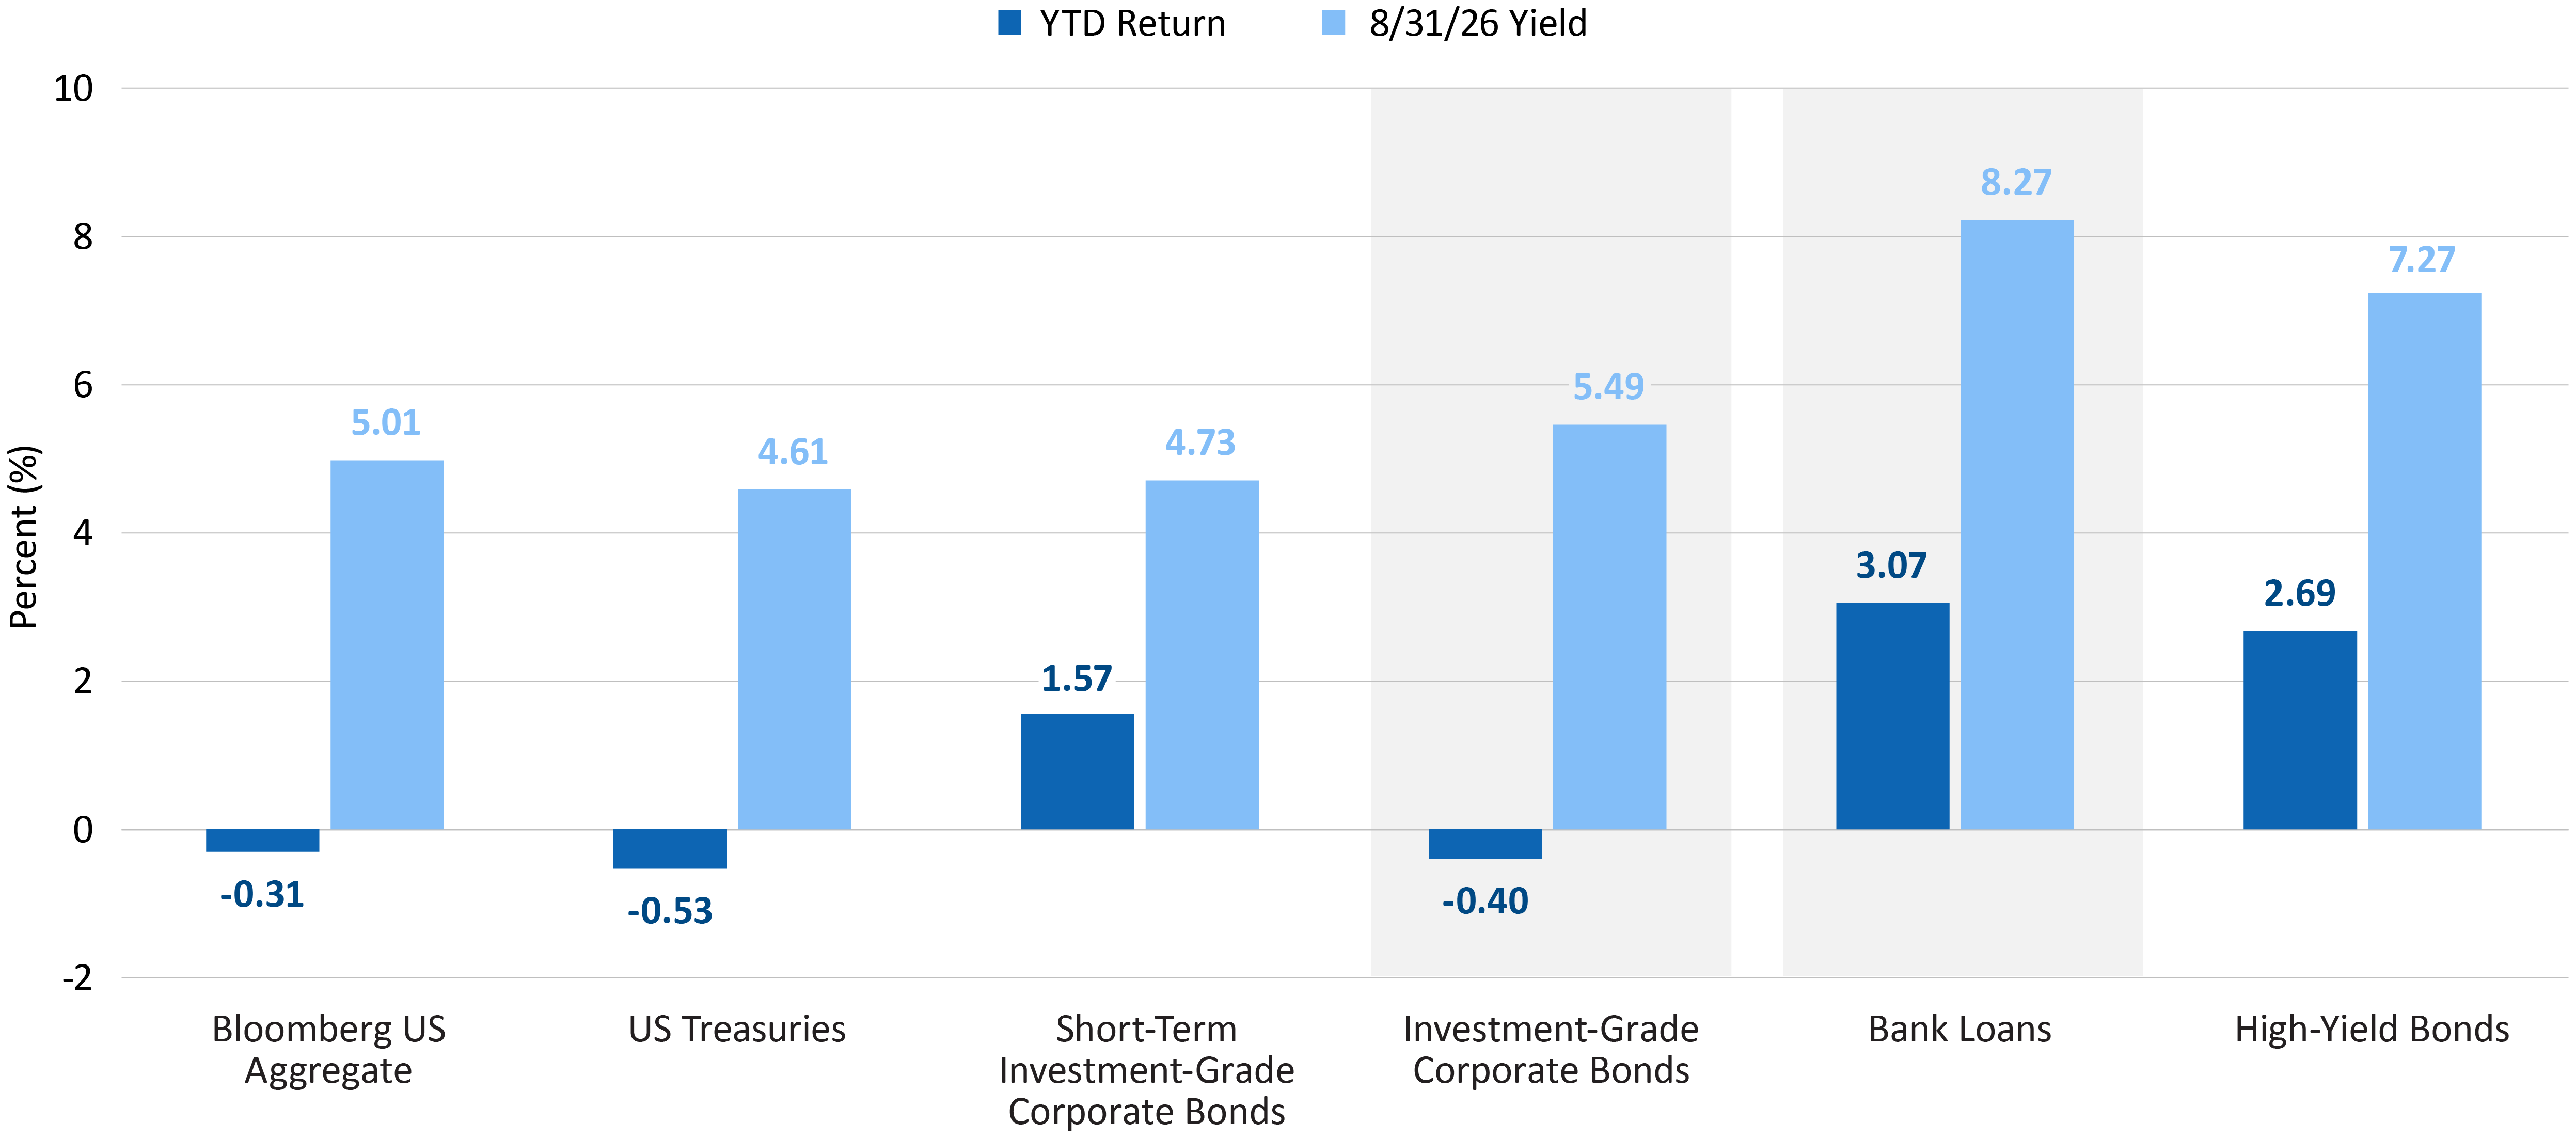
Let's shift to the broader bond market. Where are you seeing opportunities in fixed income today?
We have long argued that bank loans have a place in one’s fixed income allocation, and they have once again acted as an anchor to the recent interest rate volatility. Bank loans are yielding more than three percentage points above the Agg, at about 8% versus about 5%.
Here’s a dramatic fact to consider: Treasury bonds of 15 years or more in duration have delivered a negative return over the past 10 years. That’s the worst performance since the 1930s, which were a difficult time for the U.S. economy. To me, that signals a compelling potential investment opportunity – investors can earn about 5% yield on long-term Treasuries, and if risk assets stumble, those investors could potentially be quite pleased with a Treasury allocation. Of course, now may not be the best time, as inflation may persist for months more, but I think it’s certainly worth monitoring.
Also, with these higher yields and the economy still strong, I see investment-grade corporates as a little more attractive.
Let's close with a personal reflection.
A couple of landmarks recently occurred with people in my life, and I have been thinking of the expression: The days are long, and the years are short. There are less than four months left in this year. Also, consider that the year 2044 is closer to us than the year 2007. Folks, the years are short; make them count.
A 10-year Treasury note is a debt obligation issued by the United States government with a 10-year maturity period.
The Atlanta Fed GDPNow provides a running estimate of real GDP growth for the current quarter using available economic data.
Bank loans (or floating-rate loans) are financial instruments that pay a variable or floating interest rate. A floating rate fund invests in bonds and debt instruments whose interest payments fluctuate with an underlying interest-rate level.
A bond is a fixed-income instrument and investment product where individuals lend money to a government or company at a certain interest rate for an amount of time. The entity repays individuals with interest in addition to the original face value of the bond.
The Bloomberg US Aggregate Bond Index (Agg) is composed of investment-grade U.S. government bonds, invest-ment-grade corporate bonds, mortgage pass-through securities, and asset-backed securities, and is commonly used to track the performance of U.S. investment-grade bonds.
Capital Expenditure (CapEx) is the money a company spends to acquire, upgrade, or maintain long-term, physical assets.
Consumer Confidence measures consumers’ attitudes and optimism about the economy and their personal financial situation.
Coupon refers to the interest payment that a bond issuer promises to pay to a bondholder.
Fixed income refers to assets and securities that pay a set level of income to investors, typically in the form of fixed interest or dividends.
Investment grade refers to the quality of a company's credit. To be considered an investment grade issue, the company must be rated at 'BBB' or higher by Standard and Poor's or Moody's.
An investment-grade bond is a type of bond that is considered to have a relatively low risk of default.
The ISM Manufacturing Index is a monthly economic indicator published by the Institute for Supply Management (ISM) that gauges the health of the U.S. manufacturing sector.
Treasury rate (or yield) refers to the interest rate at which the U.S. government borrows money by issuing Treasury securities.
Yield is the income returned on an investment, such as the interest received from holding a security.
A yield curve plots the interest rates of bonds that have equal credit quality but different maturity dates.
Yield-to-Worst is the lowest potential yield that can be received on a bond without the issuer defaulting.
Any performance data quoted represents past performance, which does not guarantee future results. Index performance is not indicative of any fund’s performance. Indexes are unmanaged and it is not possible to invest directly in an index. For current standardized performance of the funds, please visit www.AristotleFunds.com.
The views expressed are as of the publication date and are presented for informational purposes only. These views should not be considered as investment advice, an endorsement of any security, mutual fund, sector or index, or to predict performance of any investment or market. Any forward-looking statements are not guaranteed. All material is compiled from sources believed to be reliable, but accuracy cannot be guaranteed. The opinions expressed herein are subject to change without notice as market and other conditions warrant.
Investors should consider a fund’s investment goal, risk, charges and expenses carefully before investing. The prospectus contains this and other information about the fund and can be obtained at www.AristotleFunds.com. It should be read carefully before investing.
Investing involves risk. Principal loss is possible.
A full list of holdings can be found at www.aristotlefunds.com and are subject to risk and to change at anytime. Any discussion of individual companies is not intended as a recommendation to buy, hold or sell securities issued by those companies.
Aristotle Funds and Foreside Financial Services, LLC are not affiliated with Pacific Life Fund Advisors LLC.
Foreside Financial Services, LLC, distributor.