
October 2026
Bond Turbulence
Download PDFWe recently sat down with Dominic Nolan, CEO of Aristotle Pacific Capital, to get his insights into recent bond market volatility, the Fed’s next move, and opportunities in fixed income. We conclude with a personal reflection.
Market Performance
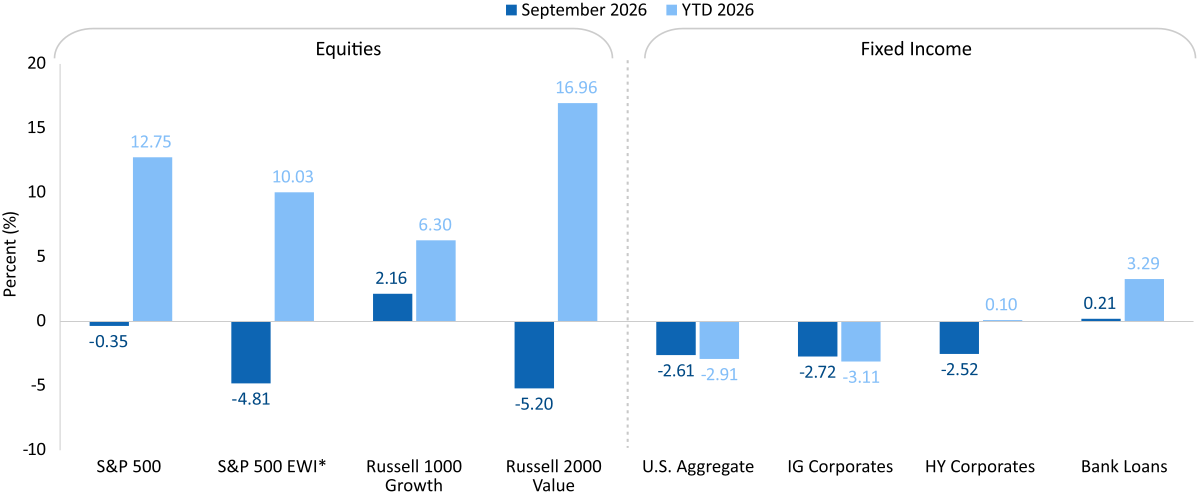
September was rough for bonds and mixed for stocks. What happened?
The primary driver of returns in September was rising yields, with the 10-year Treasury yield starting the month at 4.8% and ending at more than 5.2%. As a result, the Bloomberg U.S. Aggregate Bond Index returned -2.6% last month. Yields have risen due to elevated inflation, which we will discuss in more detail later; for now, I will summarize the primary drivers as the persistence of high energy prices, diminishing hopes for a resolution to the conflict with Iran, and recent developments in the Russia-Ukraine war. The month also marked a Federal Reserve meeting where the central bank raised the federal funds rate to a range of 3.75% to 4%.
Meanwhile, the focus on artificial intelligence and data centers is leading to arguably the largest infrastructure build in U.S. history, which is contributing to inflationary pressures as well as hundreds of billions of dollars in bond issuance.
Amid this backdrop, the S&P 500 Index’s return was slightly negative in the month, though the overall market was mixed with growth stocks in positive territory.
Mag 7 (& Co.)
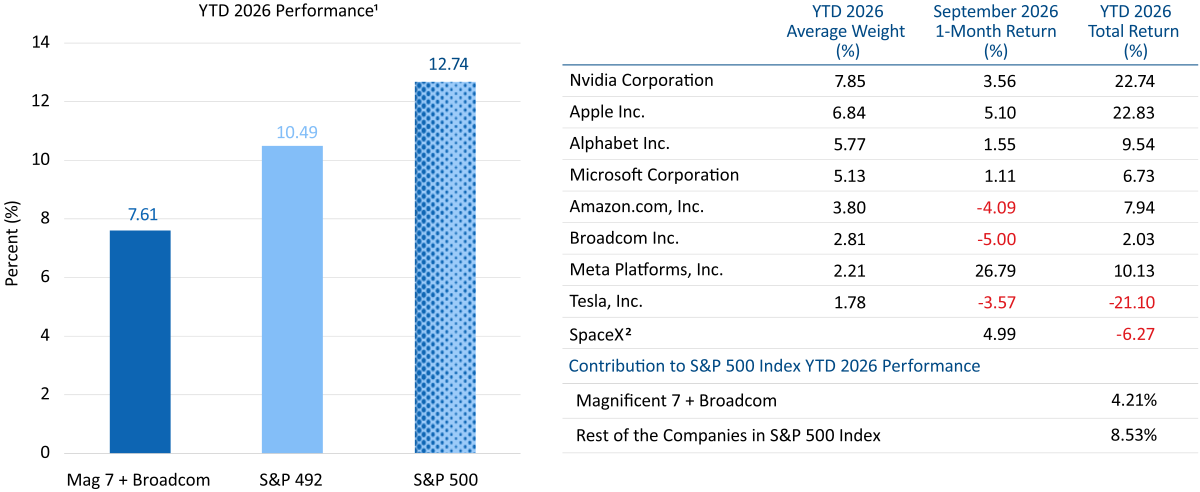
Speaking of growth, how did the Mag 7 (& Co.) perform last month?
Their performance was also mixed. Meta led the group, returning nearly 27% in September, while Broadcom was the laggard, declining 5%. Meta rallied after the September 8 release of their consumer AI agent Muse. It came as a welcome relief to investors, helping justify Meta’s forecasted $130 billion to $145 billion in 2026 capital expenditures and helping Meta get closer to consumer transactions, rather than relying on advertising. Muse is technically the first mass-market AI agent; it can continue performing tasks for consumers even if the app is closed on their device. I found the app interesting and helpful. We are now in the age of agentic AI.
Also of note last month, Nvidia increased the size of its share buyback plan by $150 billion, a record amount in the U.S., which brings its total authorized amount to $235 billion. While the stock modestly increased by about 3.6%, it has returned nearly 23% over the past nine months, and its market cap has approached $6 trillion. It’s arguably the most influential stock today.
Economic Dashboard
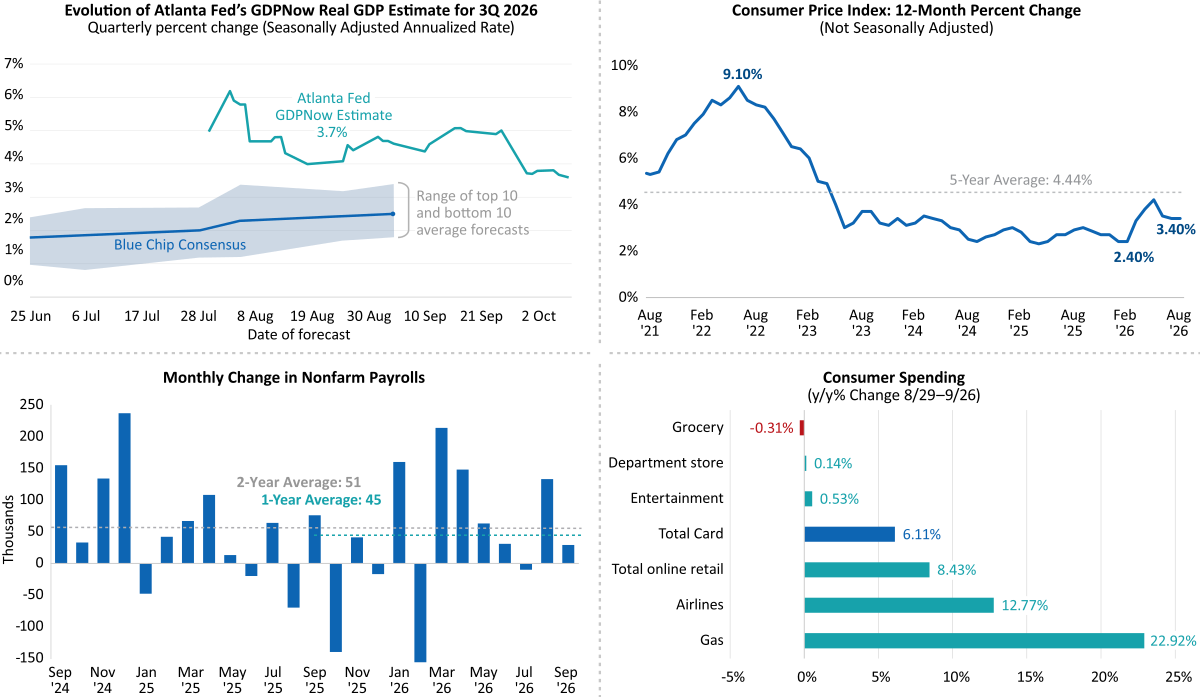
What does the current data tell us about the U.S. economy?
For the most part, the economy is humming along. Since our last conversation, the Bureau of Economic Analysis increased its calculation of second-quarter real GDP expansion from 1.5% to 2.2%. The BEA estimates second-quarter nominal GDP increased 8.5%, a monster number and worth noting even if economists generally don’t focus on nominal expansion. The resilience continues; the Federal Reserve Bank of Atlanta’s real GDPNow indicator for third-quarter growth has been 3.6% recently. Meanwhile, inflation continues above the Fed’s target with energy and gas increasing at double-digit rates in August.
Other indicators counterbalance the growth outlook. The economy added 29,000 jobs in September, when analysts had expected 84,000, and the unemployment rate ticked up slightly to 4.2%. The Bureau of Labor Statistics also revised job gains lower by a combined 60,000 for July and August. The market rallied the day of the BLS release on optimism there was less pressure on the Fed to raise interest rates.
Wages rose 3% on an annual basis, according to the BLS, lower than the rate of inflation. Yet Bank of America data on credit card activity indicates consumers increased spending more than 6% for the four weeks ending September 26 versus a year ago, which suggests consumers are dipping into savings. Spending on gas increased nearly 23% over the period tracked by BofA versus a year earlier, while airline spending increased 12.8%. Grocery spending declined slightly, which could reflect less eating and drinking due to the adoption of GLP-1 medications.
Once again, I circle back to the great AI build. The most powerful companies in the country are engaged in an AI race, building to win and not worrying about costs. Interestingly, if the energy dynamics were stable, I think asset pricing would be higher, and yet, if not for the AI build, I think the economy would likely be much slower, with asset prices lower. Bottom line: the AI build is leading to this major tradeoff and unique economic balance, with the average worker getting strained.
Global Bond Selloff: Change in 10-Year Government Bond Yields
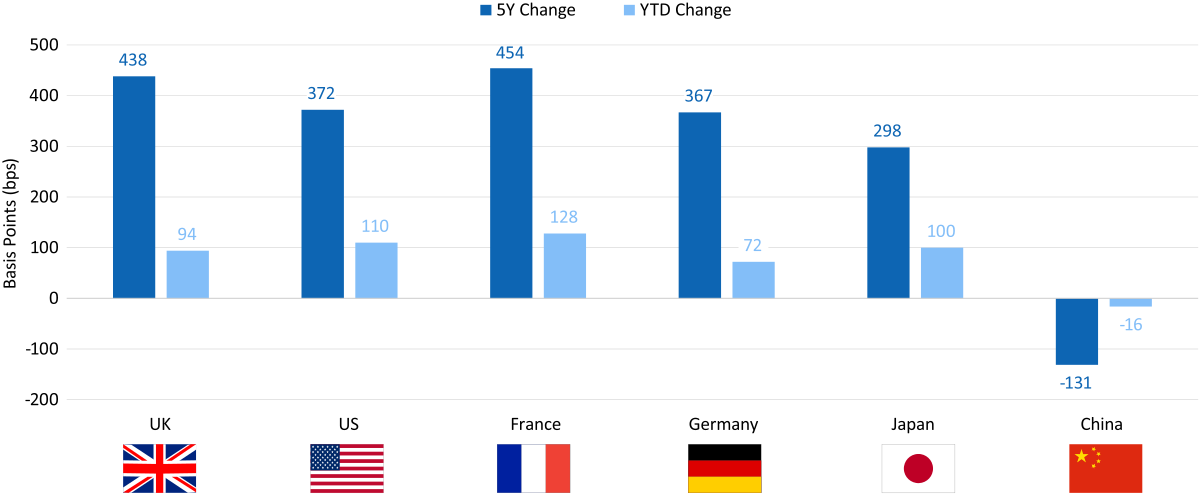
Let’s switch to our special topic: bond market turbulence. We started discussing the rise in U.S. yields in September. Could you broaden the discussion to other countries?
Since 2021, yields on 10-year government bonds are up about 300 to 450 basis points in the U.S., U.K., France, Germany, and Japan. The biggest surprise is in Japanese rates, with the 10-year up nearly 300 bps since 2021, including 100 bps year to date, after decades of being below 1%. Inflation has been a global headwind for bonds, driving yields higher and pressuring bond values across the globe.
China is the exception with the 10-year yield down about 130 bps over the past five years, as their economy faces disinflationary forces.
Commodity Curves Signal Near-Term Price Pressure
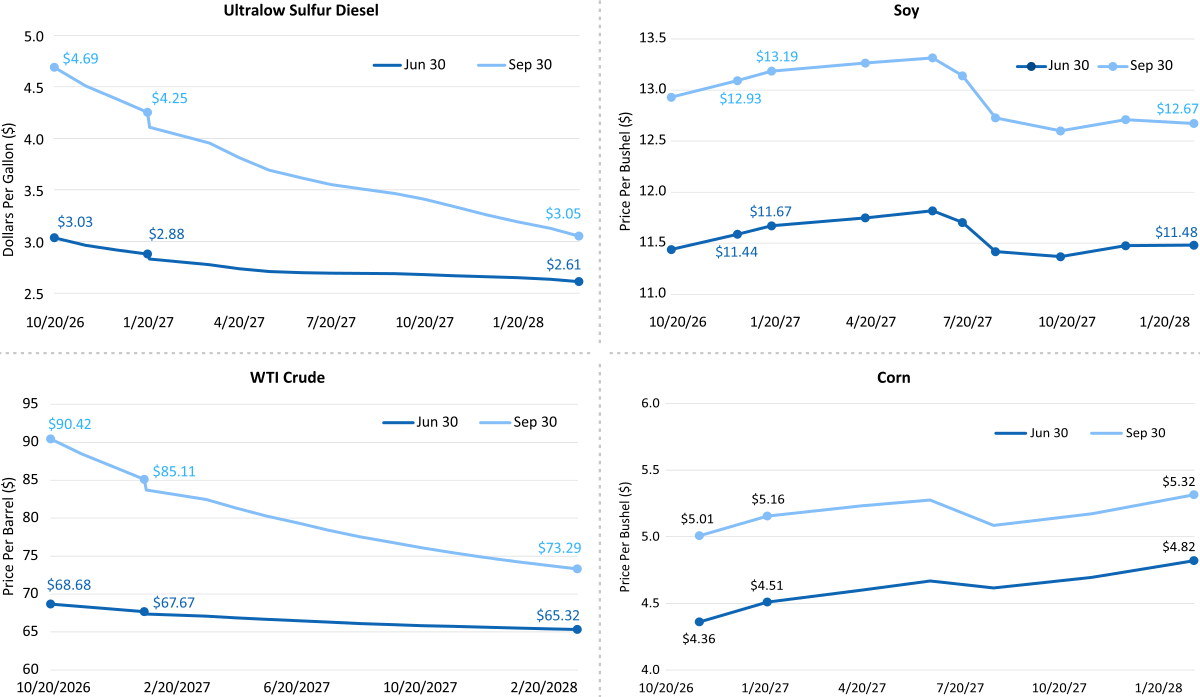
What are commodity prices telling us about inflation pressures?
The good news is diesel and crude oil curves are in backwardation out to early 2028, signaling that commodity investors expect prices to decline over the next year or two. The bad news is that across energy and food commodity curves investors still expect prices in early 2028 to be higher than they had forecast a few months ago for that same period, even if energy prices trend down from today’s level. Essentially, the entire futures curves have shifted upward. I believe those expectations reflect everything we have discussed, including the disruption of seaborne traffic through the Strait of Hormuz, the Russia-Ukraine war, and the AI build.
Diesel Destruction: Premium to Crude Far Above Norms; Inventories Strained
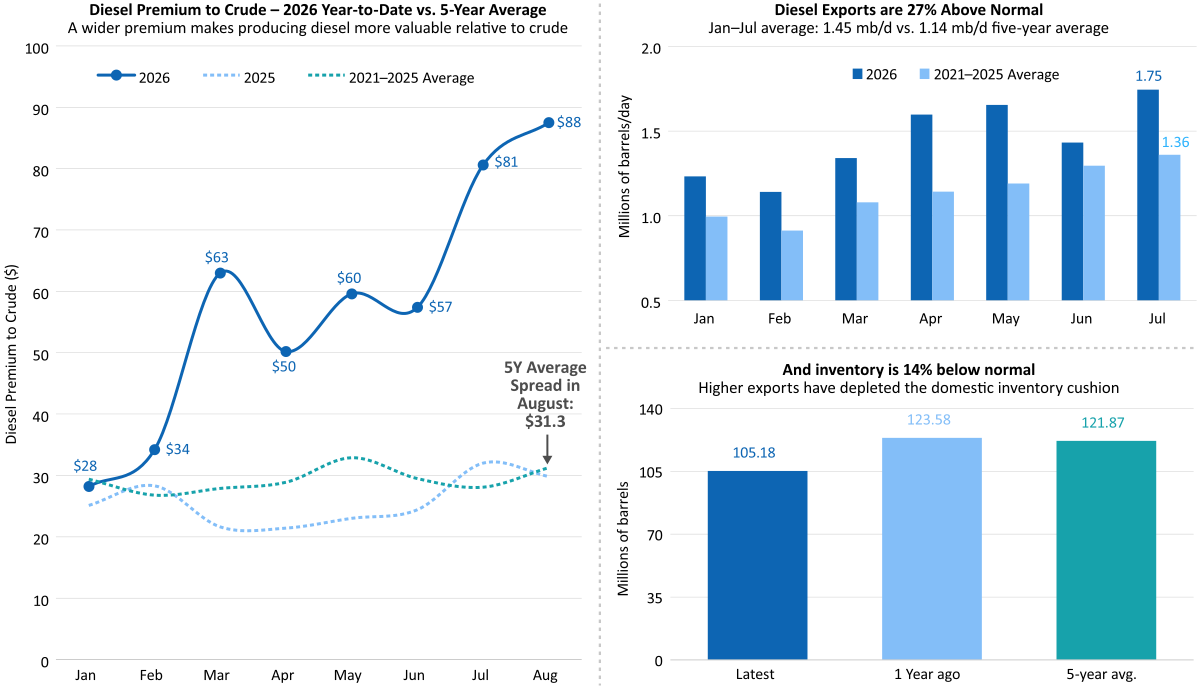
Why does the price of diesel have such a meaningful impact on inflation?
I think diesel prices are an underestimated but fundamental driver of inflation in this cycle. While consumers care about the price at the pump, which they are confronted with, almost everything else gets transported using diesel, in addition to farming and heating needs. The average premium of a barrel of diesel to crude oil over the past five years is about $31, as diesel provides more energy per gallon; at the end of August, that premium hit $88, nearly triple. The main driver of that premium has been the disruption of the strait. While crude oil shipping through the strait is close to pre-conflict capacity, refined products such as diesel are closer to 20%. In addition, Ukraine has attacked Russian oil refineries, and Russia’s government has severely limited diesel exports. Meanwhile, U.S. exports have increased to meet global demand, with U.S. refineries running near capacity.
At this point, even if the strait were to fully reopen, global diesel inventories would take time to replenish, assuming it could despite Russia’s constraints, and the winter season is coming, which should increase heating demand.
Chasing Expectations: Federal Reserve Market Expectations vs. Inflation Expectations
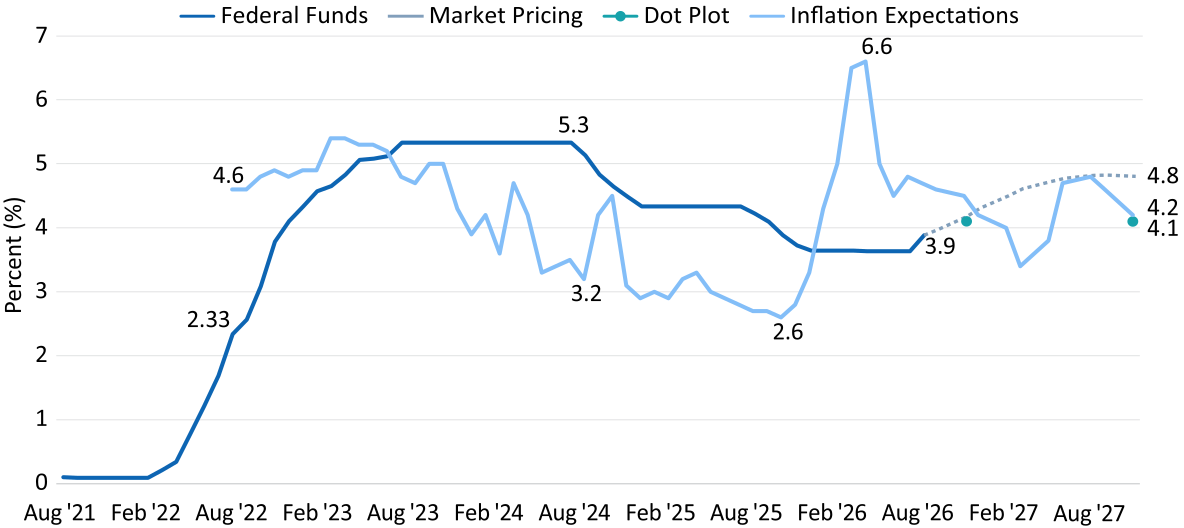
How has the trend in inflation affected inflation expectations?
As we were coming out of the COVID pandemic, inflation expectations were in the 4% to 5% range, then trended down to 2.6% in early 2026, prior to the U.S. attack on Iran. Inflation expectations peaked within a few months of the attack to 6.6% and have since trended back to the mid-4% range. One could focus on the fact that expectations have come down from the peak, but keep in mind they remain well above the Fed’s 2% target for inflation, and those expectations remain above target looking out into 2027. The Fed has already raised rates once. Depending on the trend in jobs and wages, we could see one or two more hikes this year.
Speaking of the Fed, Kevin Warsh has used his short tenure thus far as chair to emphasize price stability. What does the path of interest rates look like beyond this year?
The outlook is highly uncertain, partly because Warsh is curtailing information over time. Also, once the conflict with Iran began, everything changed. The market has discounted the energy market disruption, with hopes for a resolution rising and then falling; meanwhile the geopolitical landscape has evolved and the hyperscalers are steamrolling the AI build. Honestly, I don’t have a great answer, beyond the likelihood of two to three more rate hikes before the Fed is done.
Rate Volatility Has Risen Sharply While Credit Remains Relatively Calm
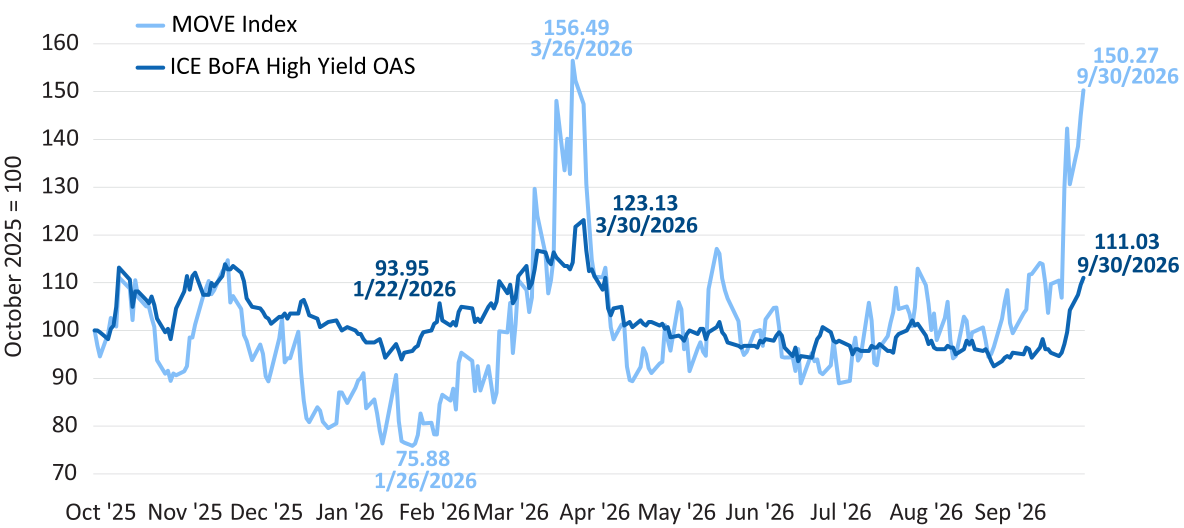
Let's talk bonds. Where are you seeing opportunities in fixed income today?
Expectations of rate volatility, as measured by the MOVE Index, spiked in September – rivaling the spike right after the U.S. struck Iran – for all the reasons we have discussed. However, the high-yield option-adjusted spread, which we consider a measure of credit volatility, did not increase as much in September, though it did trend upward. In essence, we have been seeing less volatility in bonds with credit risk than bonds with pure interest rate risk, such as Treasuries. This is an important dynamic for bond investors as they assemble fixed income allocations.
Opportunities in Fixed Income
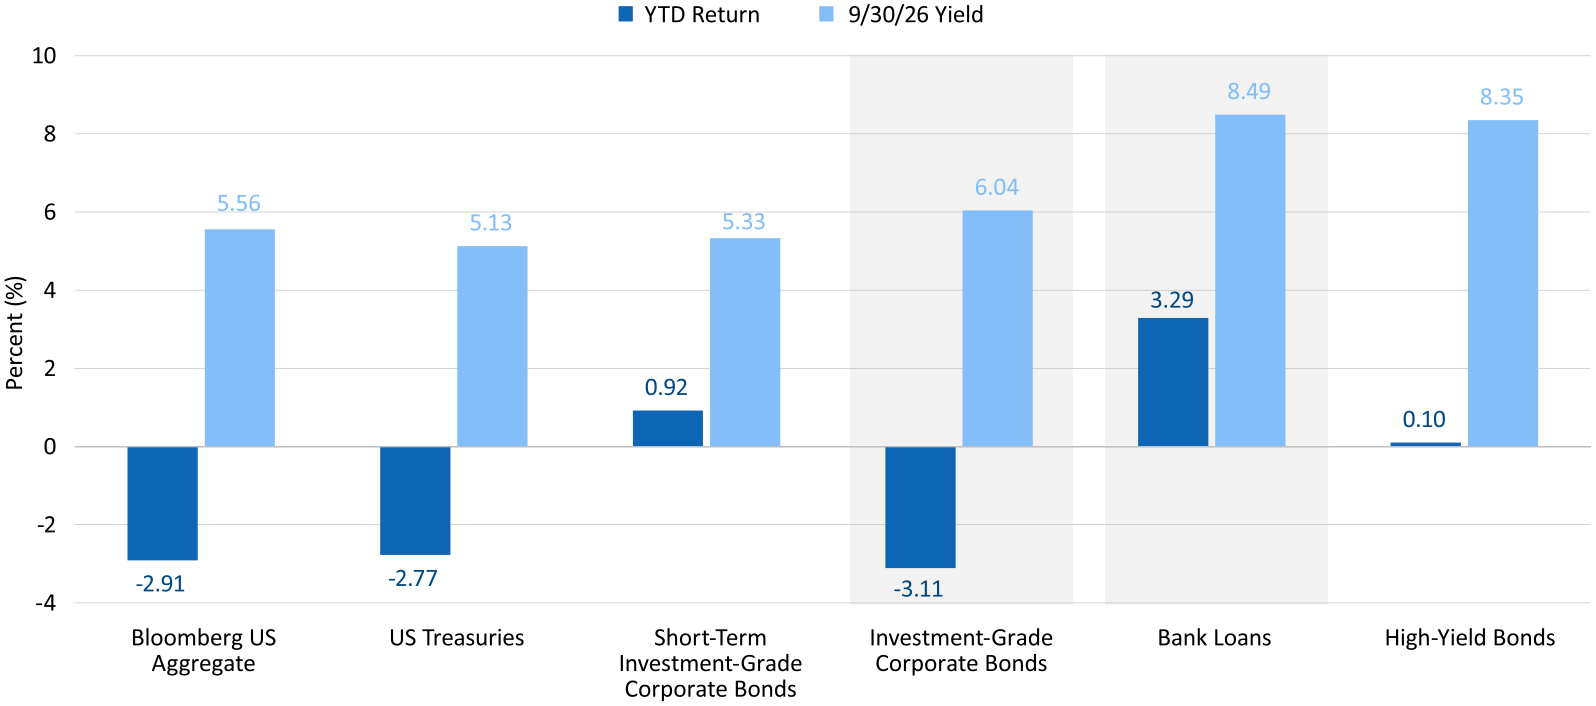
Year-to-date returns of U.S. Treasuries and investment-grade corporate bonds have turned negative, as they are largely fixed-rate instruments that tend to decline in value when yields rise. However, high-yield bonds and bank loans, which are largely influenced by spread volatility, have fared better, with bank loans returning more than 3% year to date. Rates on bank loans generally are adjustable, rising and falling with market trends, and thus bank loans can outperform in a rising rate environment. Indeed, bank loans are outperforming the Agg by more than 600 basis points year to date.
We have long argued for a diversified and balanced fixed income portfolio to navigate market cycles, and this is a classic example. Currently, I suggest staying calm as this volatility persists. Keep a bank loan allocation and short-term allocation if you have them. When the market eventually settles, there may be an attractive opportunity to extend duration. The MOVE Index settling could signal a time to consider duration.
Final thought: yields on IG corporate bonds are in the 6% range and for leveraged finance in the 8% range. Those are attractive levels.
Let’s close with a personal reflection.
We are weeks away from the midterm elections. I was not born in this country, and I have come to appreciate that the most important right we have is the right to vote. About two thirds of eligible voters have voted in recent presidential elections. The participation rate tends to fall below 50% for midterms, meaning typically less than half of adults in the country care enough to either research or take the time to cast their vote. Please be included in the half that participates; take advantage of the right that so much of the world wished they had.
A 10-year Treasury note is a debt obligation issued by the United States government with a 10-year maturity period.
The Atlanta Fed GDPNow provides a running estimate of real GDP growth for the current quarter using available economic data.
Bank loans (or floating-rate loans) are financial instruments that pay a variable or floating interest rate. A floating rate fund invests in bonds and debt instruments whose interest payments fluctuate with an underlying interest-rate level.
A bond is a fixed-income instrument and investment product where individuals lend money to a government or company at a certain interest rate for an amount of time. The entity repays individuals with interest in addition to the original face value of the bond.
The Bloomberg US Aggregate Bond Index (Agg) is composed of investment-grade U.S. government bonds, investment-grade corporate bonds, mortgage pass-through securities, and asset-backed securities, and is commonly used to track the performance of U.S. investment-grade bonds.
Capital Expenditure (CapEx) is the money a company spends to acquire, upgrade, or maintain long-term, physical assets.
Consumer Confidence measures consumers’ attitudes and optimism about the economy and their personal financial situation.
Coupon refers to the interest payment that a bond issuer promises to pay to a bondholder.
Fixed income refers to assets and securities that pay a set level of income to investors, typically in the form of fixed interest or dividends.
Investment grade refers to the quality of a company's credit. To be considered an investment grade issue, the company must be rated at 'BBB' or higher by Standard and Poor's or Moody's.
An investment-grade bond is a type of bond that is considered to have a relatively low risk of default.
The ISM Manufacturing Index is a monthly economic indicator published by the Institute for Supply Management (ISM) that gauges the health of the U.S. manufacturing sector.
Treasury rate (or yield) refers to the interest rate at which the U.S. government borrows money by issuing Treasury securities.
Yield is the income returned on an investment, such as the interest received from holding a security.
A yield curve plots the interest rates of bonds that have equal credit quality but different maturity dates.
Yield-to-Worst is the lowest potential yield that can be received on a bond without the issuer defaulting.
Any performance data quoted represents past performance, which does not guarantee future results. Index performance is not indicative of any fund’s performance. Indexes are unmanaged and it is not possible to invest directly in an index. For current standardized performance of the funds, please visit www.AristotleFunds.com.
The views expressed are as of the publication date and are presented for informational purposes only. These views should not be considered as investment advice, an endorsement of any security, mutual fund, sector or index, or to predict performance of any investment or market. Any forward-looking statements are not guaranteed. All material is compiled from sources believed to be reliable, but accuracy cannot be guaranteed. The opinions expressed herein are subject to change without notice as market and other conditions warrant.
Investors should consider a fund’s investment goal, risk, charges and expenses carefully before investing. The prospectus contains this and other information about the fund and can be obtained at www.AristotleFunds.com. It should be read carefully before investing.
Investing involves risk. Principal loss is possible.
A full list of holdings can be found at www.aristotlefunds.com and are subject to risk and to change at anytime. Any discussion of individual companies is not intended as a recommendation to buy, hold or sell securities issued by those companies.
Aristotle Funds and Foreside Financial Services, LLC are not affiliated with Pacific Life Fund Advisors LLC.
Foreside Financial Services, LLC, distributor.