July 2026
Markets at Mid-Year
Download PDFWe recently sat down with Dominic Nolan, CEO of Aristotle Pacific Capital, for a mid-year update on the economy and markets, as well as his insights on the Fed and market-moving events in June. We conclude with a personal reflection.
Market Performance
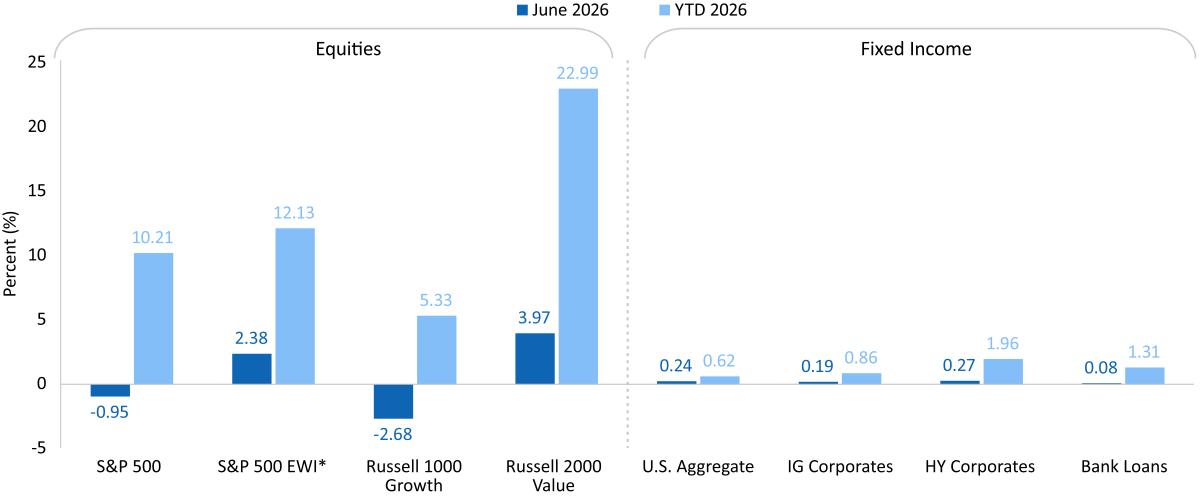
Performance was mixed for stocks and bonds in June. What happened?
Markets pivoted as the Middle East conflict continues to oscillate, with June providing some de-escalation. The first half of June was choppy, but as military tensions appeared to ease, oil prices fell, and stocks regained most of their losses by month-end. The S&P 500 Index declined slightly in June but is up more than 10% year to date. We also continued to see market performance broaden beyond mega-cap tech. The S&P 500 Equal Weight Index gained 2.4% in June and is up more than 12% this year. While the Russell 1000 Growth Index declined 2.7% in June and is up a modest 5.3% year to date, the Russell 2000 Value Index returned nearly 4% in June and has gained about 23% year to date.
Compared with the drama in equities, the bond market has been relatively quiet. The Bloomberg U.S. Aggregate Bond Index was slightly positive in June and is up 62 basis points (bps) so far this year. High yield corporates led the pack, returning 27 bps in June and nearly 2% year to date.
Mag 8
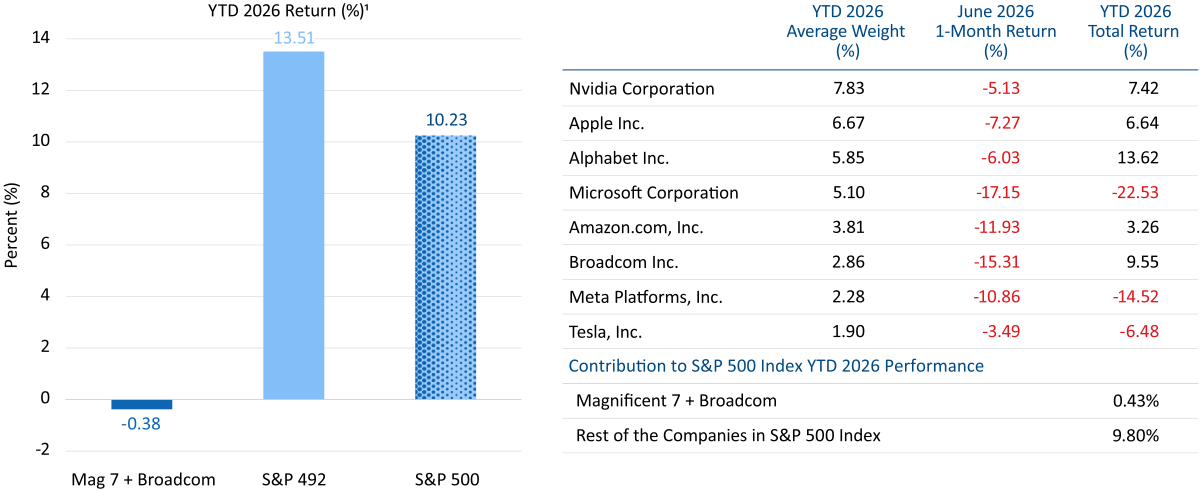
You mentioned the rotation beyond tech. What are your thoughts on the performance of our Mag 8?
They had a challenging month; the Mag 7 alone lost more than $2 trillion in market capitalization. Investors continue to question the hundreds of billions of dollars these companies are investing in data centers and chips to power artificial intelligence. High demand has contributed to a global shortage of memory chips, prompting Apple and Microsoft to raise prices. With investors also concerned that AI could displace existing software services, Microsoft was the worst performer among the mega-cap companies, falling about 17% during the month. Returning to the theme of performance rotation, while our Mag 8 have been slightly negative year to date, the rest of the S&P 500 has returned more than 13%.
SpaceX Records the Largest IPO in History
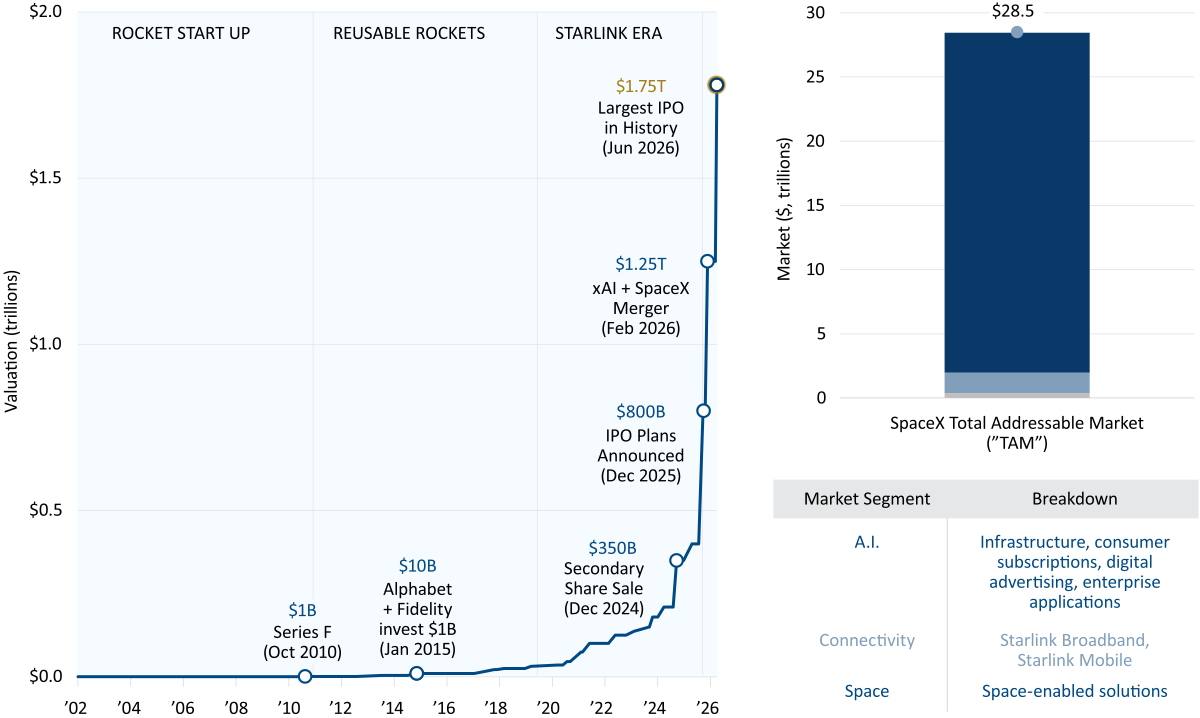
In other news, SpaceX has become a new mega-cap company. It is still early, but as of this conversation, its market capitalization is about $2 trillion. Despite its name, space-enabled solutions account for only a small portion—$370 billion—of the $28.5 trillion total addressable market identified in the company’s IPO filing. Connectivity, including Starlink Broadband and Starlink Mobile, account for $1.6 trillion, while the lion’s share—$26.5 trillion—comes from AI, including enterprise applications, consumer subscriptions, and digital advertising, according to the company’s filing. I expect SpaceX or Starlink to become a cell phone carrier within the next few years. It is also remarkable that a company founded about a quarter-century ago has made such substantial gains over the past two years, turning several executives and many shareholders into millionaires and some into billionaires.
U.S. Treasury Yield Curve Range
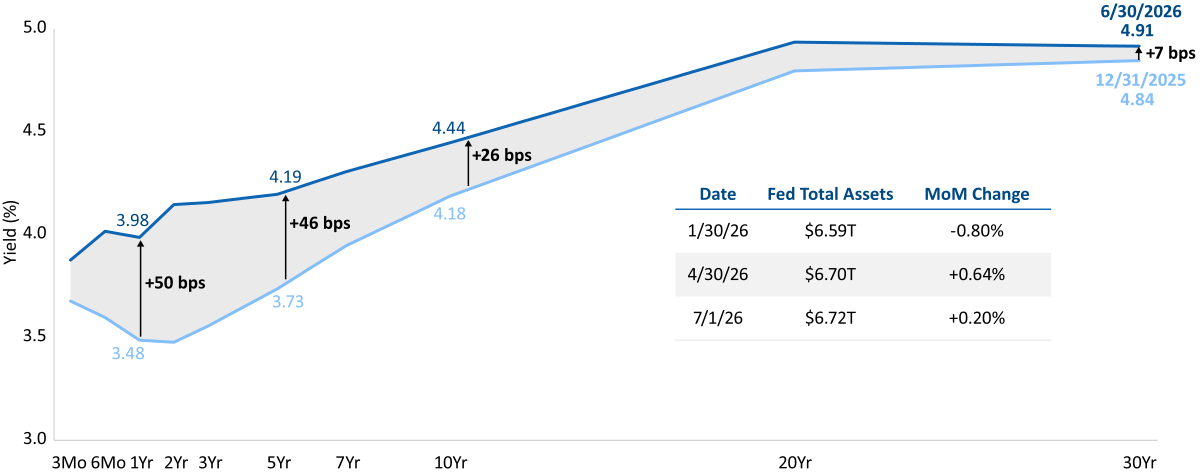
U.S. Treasury yields rose significantly along the short end and belly of the curve in June compared with the beginning of the year, while rising only modestly at the long end. What drove rates last month?
War-related tensions, oil and gas prices, and overall inflation have all been correlated. Although tensions appeared to ease after the U.S. and Iran signed a memorandum of understanding in June, they remain elevated compared with the period before the conflict, and in early July hostilities flared again. The situation remains fluid, and the uncertainty contributes to higher inflation expectations and bond yields.
Also, the short end of the curve reflects market expectations that the Federal Reserve will raise the fed funds rate at least once this year to address inflation, while the long end remains anchored. The 10-year Treasury yield has hovered around 4.5%, which I consider a temporary high and an attractive entry point for fixed income. Finally, we are monitoring the Fed’s balance sheet and how it may evolve under Chair Kevin Warsh.Warsh held his first meeting last month as the new Fed chair. How did the market interpret his comments and the scraping of forward guidance?
Fed Futures
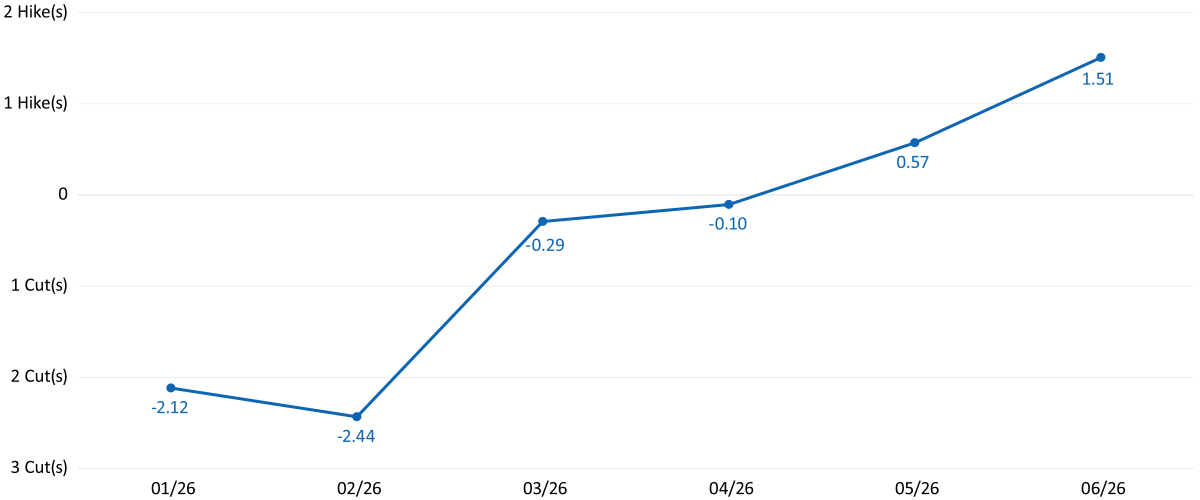
Warsh held his first meeting last month as the new Fed chair. How did the market interpret his comments and the scraping of forward guidance?
Communication will be simpler, which to me means less communication. Notably, Warsh refrained from participating in the Fed’s quarterly rate projections, known as the dot plot. He argues that forward guidance can limit the Fed’s flexibility. However, I view the move away from forward guidance as a sign of a less independent Fed; in other words, policymakers are giving themselves more room to respond to political factors.
Overall, however, the Fed shifted a bit hawkish, ending the FOMC statement with the line, “The Committee will deliver price stability.” At the beginning of the year, the market expected two rate cuts in 2026; by the end of June, it expected 1.5 hikes by year-end. I think investors would be more concerned if not for President Trump’s influence. It is difficult to imagine the Fed raising rates so quickly under Warsh, who assumed the role with a dovish mandate from the president.
Economic Dashboard
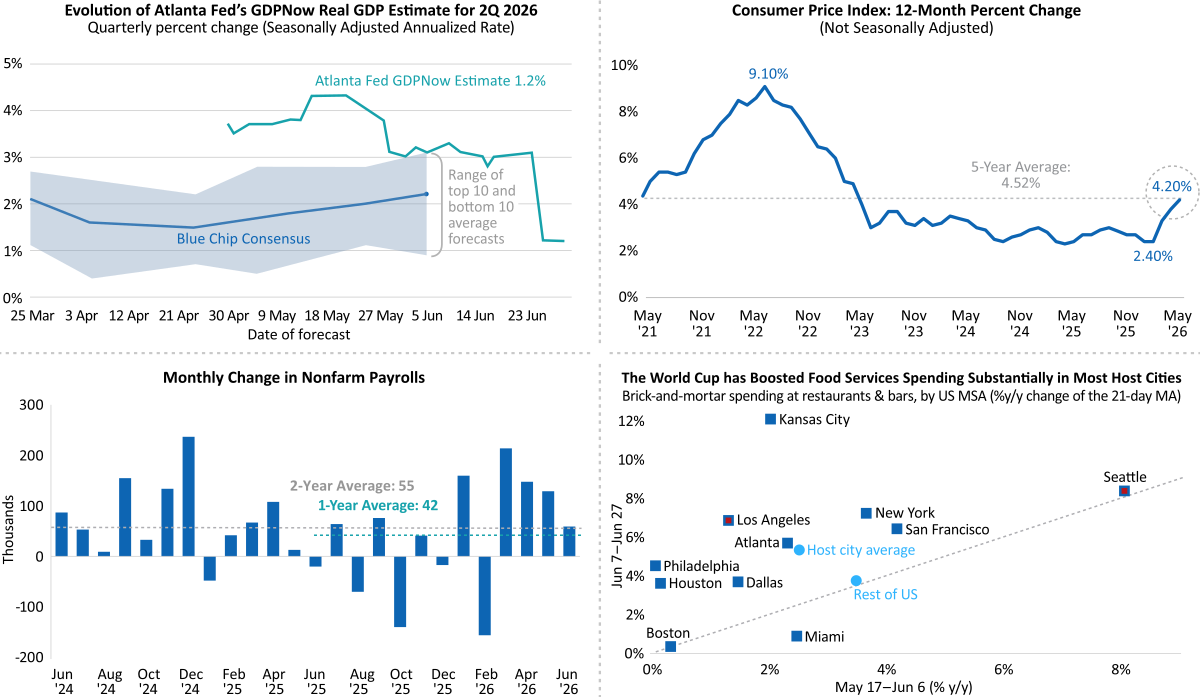
Let’s shift to our special topic: a mid-year check-in on the economy and markets. For starters, what is happening with economic growth?
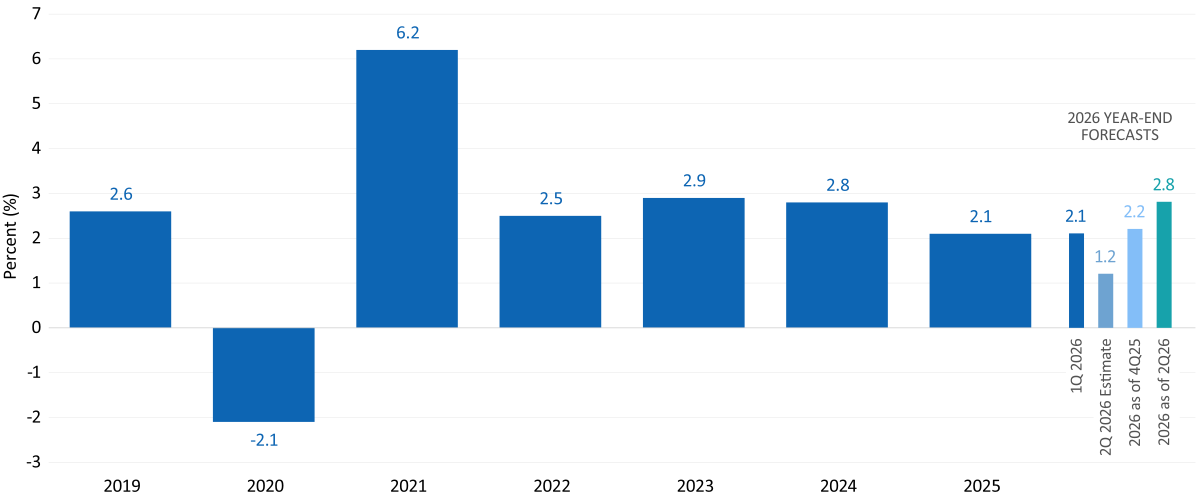
Real GDP growth lately has been around 1%, and I expect it to fluctuate ~2% this year, ending above the 2.2% rate at the start of the year. That may sound low, but nominal GDP is closer to 5% to 6%, given that the Consumer Price Index reached 4.2% in May—a significant increase from prior months. Meanwhile, employment data has been mixed for months. For example, employers added 57,000 jobs in June, below the expected gain of 115,000, while the unemployment rate was 4.2%. However, that low rate reflects people leaving the labor force.
Following up on last month’s focus on the World Cup, data on U.S. credit card holders in host cities through June 6 shows a significant increase in spending at local restaurants and bars, except in Boston and Miami. Fun fact: Those cities hosted games in which Scotland participated, and visiting Scottish fans may have crowded out locals as they celebrated as the BofA data tracks domestic card spend.
GDP: 2026 Year-End Forecasts
10-Year Treasury Rates: 2026 Year-End Forecasts
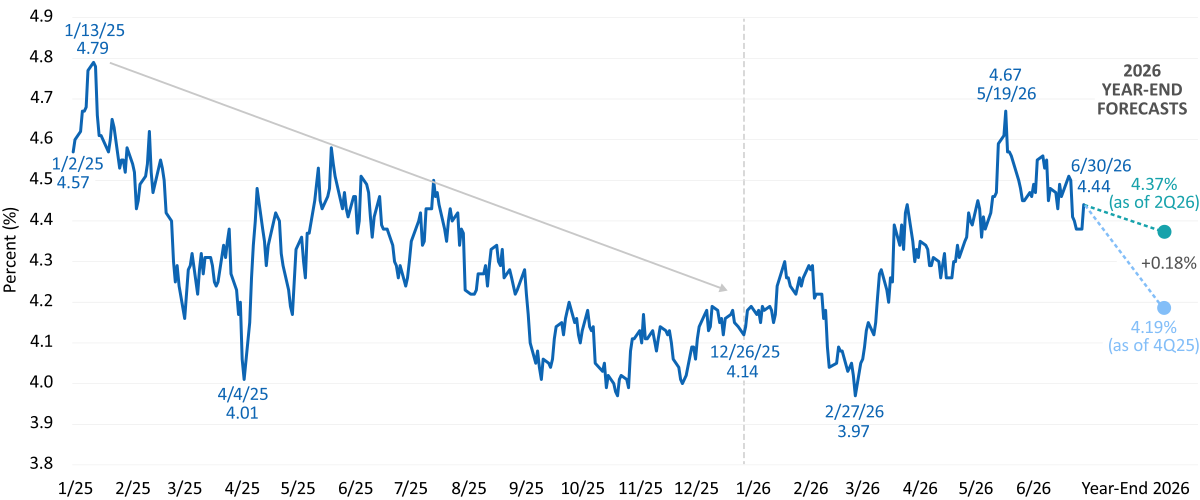
Circling back on Treasury yields, how have the sell-side forecasts for the 10-year Treasury fared?
For the most part, we have all been wrong. The 10-year yield trended lower in the second half of 2025, and forecasts at the beginning of this year called for it to fluctuate around 4.2% to 4.3%. That level seemed appropriate until the Iran conflict began. The yield spiked from a low of 3.97% in February to a high of 4.67% in May, following the outbreak of hostilities and Iran’s halt of seaborne traffic through the Strait of Hormuz. In recent weeks, the yield has hovered around 4.5%. I do not view a 30-basis-point increase in yields as alarming, but we will have to see whether inflation accelerates further.
CPI: 2026 Year-End Forecasts
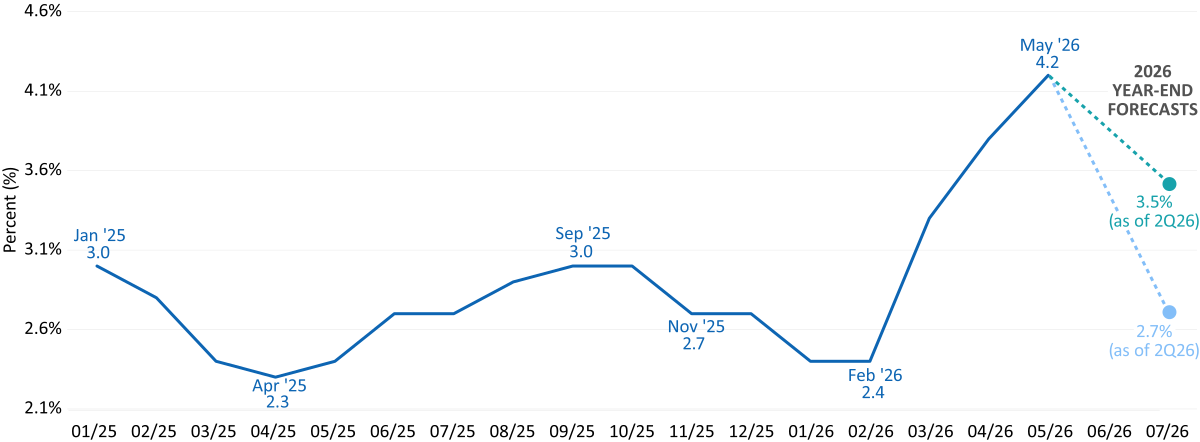
What are your expectations for inflation?
At the start of the year, CPI was close to 2%; as mentioned, it rose to 4.2% in May. I expect inflation to remain elevated for some time as disruptions to oil and raw-materials distribution caused by the closure of the Strait of Hormuz continue to ripple through the global economy. For example, we have previously discussed the dramatic decline in available fertilizer. That decline takes time to affect crop yields, which then puts upward pressure on food prices. In addition, relations between the U.S. and Iran remain volatile, and the future of traffic through the strait remains uncertain.
S&P 500 Index: 2026 Year-End Forecasts
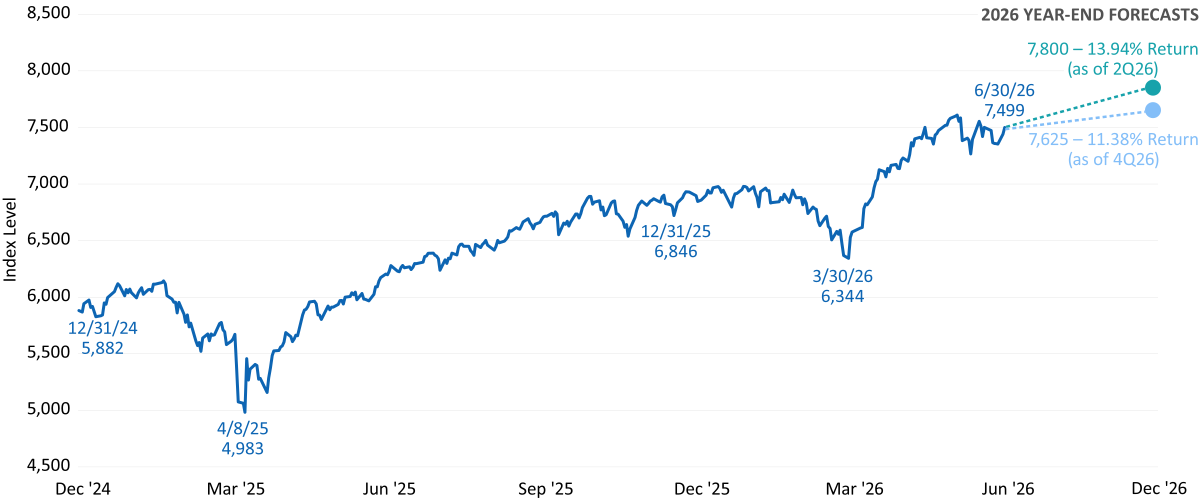
How have sell-side forecasts for the S&P 500 Index fared?
I think the sell side tends to underestimate U.S. equities. Typically, forecasters take the S&P 500 level at the end of the previous year and add about 8%, or close to 10% in more bullish forecasts. The index was already up about 10% at the end of June. If it simply moves sideways from here, many analysts will fall short of the mark. I expect forecasters will once again have underestimated equity-market resilience when 2026 ends.
NACHO Problem
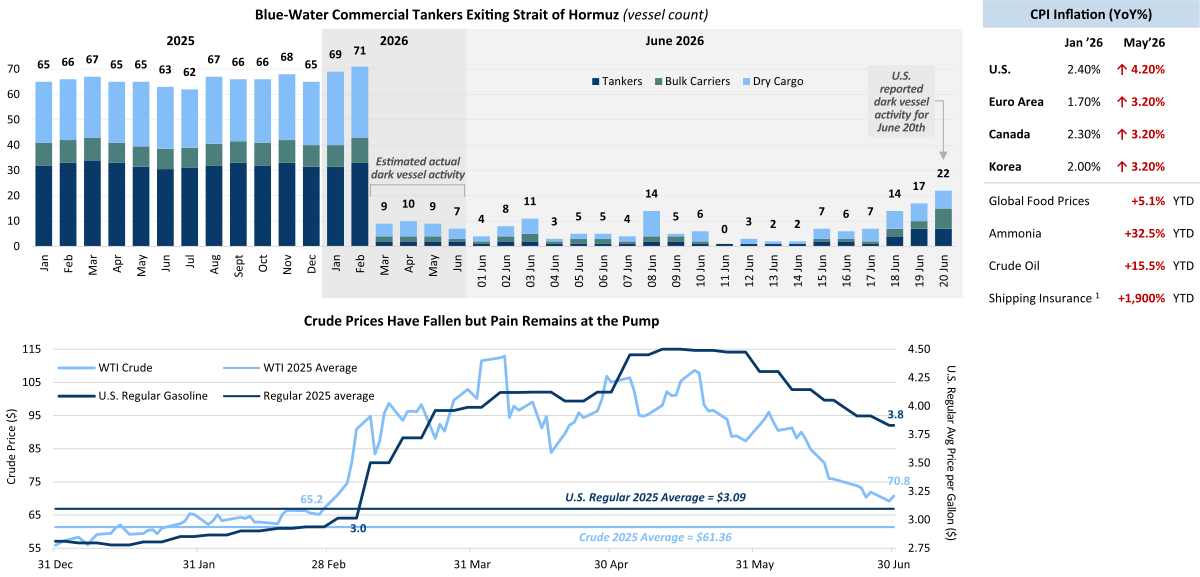
Recently, oil has traded as if the conflict with Iran never happened. What’s your outlook for oil?
In May, The Wall Street Journal ran an article describing the NACHO trade—Not A Chance Hormuz Opens—based on the idea that energy prices and overall inflation would keep rising until the resulting pain finally forces a resolution to the conflict. Lately, however, with NACHO still a problem, oil prices are near $80 a barrel as of this conversation. To be sure, prices at the pump and overall inflation remain elevated. Still, significantly more oil is bypassing the strait through pipelines—and, to a lesser extent, trucks—than when the conflict began. Oil traders also appear to expect an increase in seaborne traffic through the strait in the foreseeable future. In any case, I think the higher consumer prices, largely ignited by this factor, will affect the midterm elections.
Funding the AI Boom: Issuer Scorecard
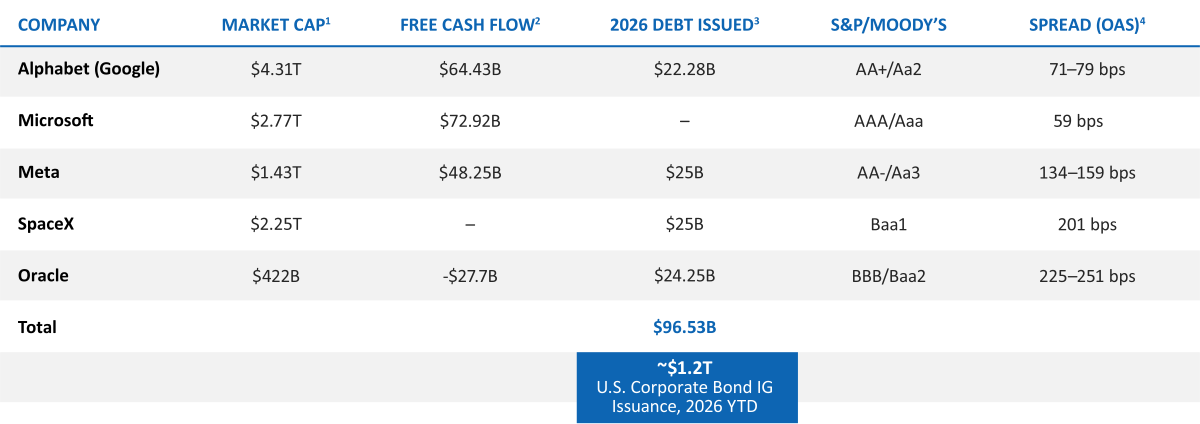
Tech companies have actively issued investment-grade bonds to support AI capital expenditures. How do you see this playing out?
Investor skepticism about the debt has affected their stock valuations, as we discussed earlier. Alphabet, Meta, Oracle, and SpaceX have each issued about $25 billion in debt this year through the end of June—a large amount, but small relative to their market capitalizations. The debt generally should therefore be “money good” given the equity cushion. However, leverage varies. Microsoft has not issued debt this year to fund AI capex, while Oracle has added significant leverage. Oracle’s forecast EBITDA for the fiscal year ending May 2027 is about $40 billion, compared with forecast capex of $95 billion over the same period and $100 billion for fiscal 2028. Oracle’s debt is rated and trades at the low end of investment grade. Ultimately, we do not know how high capex will rise for these companies, but it has certainly been a critical driver of the investment-grade market this year.
Mid-Year Predictions
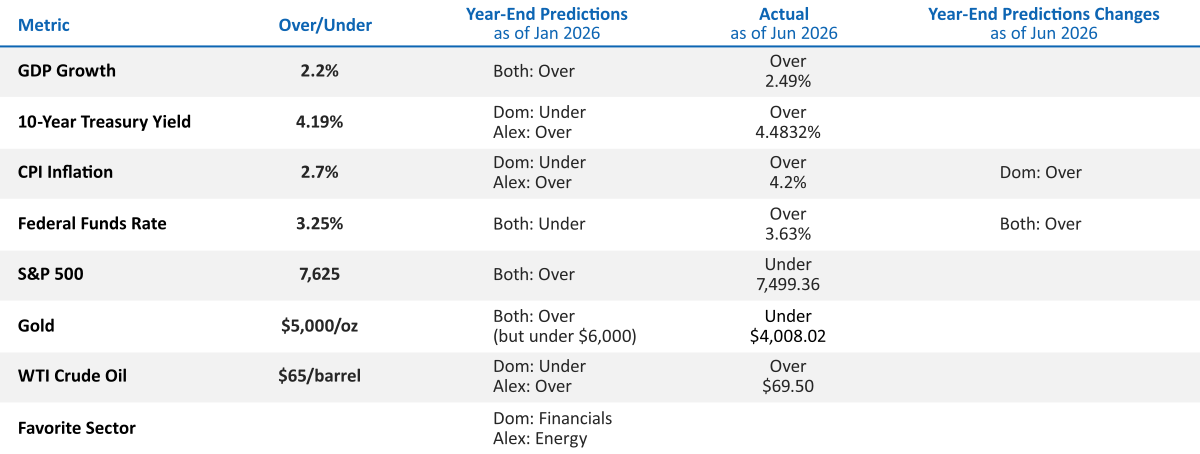
In January, you made predictions for year-end 2026. How are you doing? Are you changing any predictions?
I expected GDP growth to exceed the 2.2% trend at the start of the year, and so far it has, trending about 2.5% for the first half. I also expect full-year GDP growth to exceed the starting level. I have already acknowledged that the 10-year Treasury yield spike has surprised me—and, I think, most others—to the upside because of the Iran conflict. However, I expect the yield to trend back toward 4.2% by year-end. I am updating two predictions: inflation and the Federal Reserve. CPI has surprised to the upside; I had expected it to decline from December’s 2.7% rate. I now expect inflation to end the year higher than it began. As a result, I also expect the fed funds rate to end the year higher than it began, reversing my initial expectation that it would end lower. I love that markets are dynamic, even if it means being wrong about the future.
Fixed Income Yields and Year-to-Date Returns
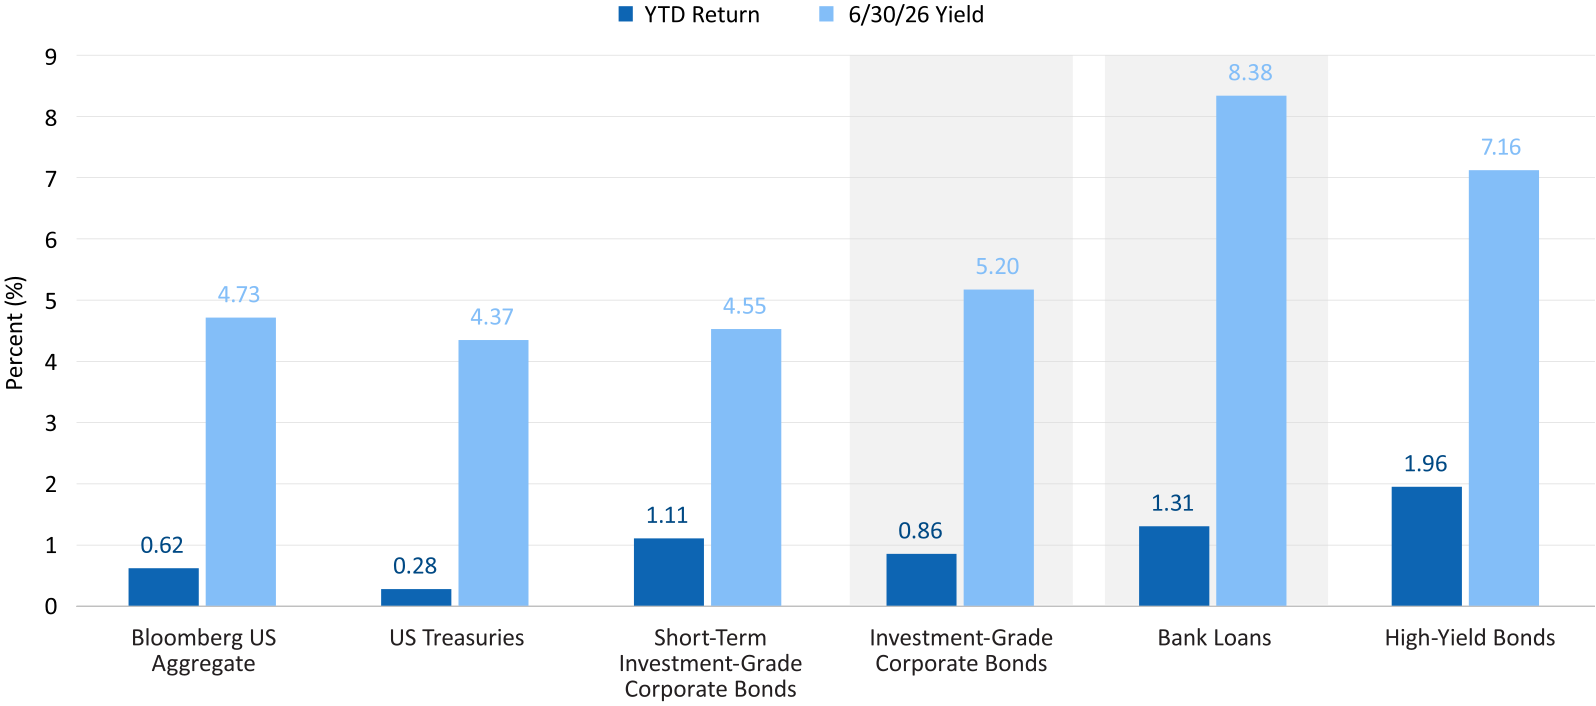
Let's talk bonds. Where are you seeing opportunities in fixed income today?
Despite all the noise this year, corporate bonds continue to perform. Investment-grade and high-yield corporate bonds, as well as bank loans, all outperformed the Agg and U.S. Treasuries in the first half. Although spreads are tight, the economy remains resilient, and I continue to see opportunities in corporate credit. High yield and bank loans continue to offer attractive yields. High yield could benefit from a dovish Fed, particularly if it faces pressure from the Trump administration, while floating-rate bank loans could benefit if the Fed raises rates.
Let's close with a personal reflection.
Last month, with the World Cup beginning, I encouraged perspective. Honestly, my word for June has been amazing. The 250th anniversary was incredible, and July 4 was epic. I was not born in the U.S., and I recognize what an amazing country this is. Also, in my view, the World Cup has been an excellent ambassador for the country. We have had a stellar showing as a host, and the U.S. men’s team has played and represented the country well. “Amazing America” is my takeaway.
A 10-year Treasury note is a debt obligation issued by the United States government with a 10-year maturity period.
The Atlanta Fed GDPNow provides a running estimate of real GDP growth for the current quarter using available economic data.
Bank loans (or floating-rate loans) are financial instruments that pay a variable or floating interest rate. A floating rate fund invests in bonds and debt instruments whose interest payments fluctuate with an underlying interest-rate level.
A bond is a fixed-income instrument and investment product where individuals lend money to a government or company at a certain interest rate for an amount of time. The entity repays individuals with interest in addition to the original face value of the bond.
The Bloomberg US Aggregate Bond Index (Agg) is composed of investment-grade U.S. government bonds, invest-ment-grade corporate bonds, mortgage pass-through securities, and asset-backed securities, and is commonly used to track the performance of U.S. investment-grade bonds.
Capital Expenditure (CapEx) is the money a company spends to acquire, upgrade, or maintain long-term, physical assets.
Consumer Confidence measures consumers’ attitudes and optimism about the economy and their personal financial situation.
Coupon refers to the interest payment that a bond issuer promises to pay to a bondholder.
Fixed income refers to assets and securities that pay a set level of income to investors, typically in the form of fixed interest or dividends.
Investment grade refers to the quality of a company's credit. To be considered an investment grade issue, the company must be rated at 'BBB' or higher by Standard and Poor's or Moody's.
An investment-grade bond is a type of bond that is considered to have a relatively low risk of default.
The ISM Manufacturing Index is a monthly economic indicator published by the Institute for Supply Management (ISM) that gauges the health of the U.S. manufacturing sector.
Treasury rate (or yield) refers to the interest rate at which the U.S. government borrows money by issuing Treasury securities.
Yield is the income returned on an investment, such as the interest received from holding a security.
A yield curve plots the interest rates of bonds that have equal credit quality but different maturity dates.
Yield-to-Worst is the lowest potential yield that can be received on a bond without the issuer defaulting.
Any performance data quoted represents past performance, which does not guarantee future results. Index performance is not indicative of any fund’s performance. Indexes are unmanaged and it is not possible to invest directly in an index. For current standardized performance of the funds, please visit www.AristotleFunds.com.
The views expressed are as of the publication date and are presented for informational purposes only. These views should not be considered as investment advice, an endorsement of any security, mutual fund, sector or index, or to predict performance of any investment or market. Any forward-looking statements are not guaranteed. All material is compiled from sources believed to be reliable, but accuracy cannot be guaranteed. The opinions expressed herein are subject to change without notice as market and other conditions warrant.
Investors should consider a fund’s investment goal, risk, charges and expenses carefully before investing. The prospectus contains this and other information about the fund and can be obtained at www.AristotleFunds.com. It should be read carefully before investing.
Investing involves risk. Principal loss is possible.
A full list of holdings can be found at www.aristotlefunds.com and are subject to risk and to change at anytime. Any discussion of individual companies is not intended as a recommendation to buy, hold or sell securities issued by those companies.
Aristotle Funds and Foreside Financial Services, LLC are not affiliated with Pacific Life Fund Advisors LLC.
Foreside Financial Services, LLC, distributor.